TrendVesting: 2.5 years of production AI, before and after agents
1,984 commits in three eras. Agents sped up the code, but the bigger change was that measuring got cheap, and the numbers overturned what I believed.
On this page
- Three eras in one git log
- ”fix it,” 108 times
- What I was building, briefly
- 9,655 trades that never happened
- 114 losses filed as target hits
- A confidence score that predicted nothing
- The market was right, and my spot feed was frozen
- Stop reporting a flag as a fact
- My cost-per-signal number, revisited
- The cost controls that held up
- How the agents are fenced in
- What this means if you run AI in production
At a glance
- Same repo, same author, three eras: 1,121 commits solo, 550 in the bot-PR era, 313 pairing with Claude Code (88% co-authored).
- Agents did not 10x my commit count. They changed the commit: 86% now carry a written rationale averaging 135 words, often with production numbers in it.
- Cheap measurement was humbling: 9,655 duplicated trade rows, 114 losses filed as target hits, and a confidence score that predicted nothing (about 34% wins at every threshold).
- Some numbers I published earlier, including hit rates and cost per signal, do not survive that audit. I say which and why.
- If your AI quality and cost numbers have never been joined against real outcomes, assume they are wrong in the flattering direction.
TrendVesting started on February 14, 2024 as a cron job that bought stocks through Alpaca. Today it is a multi-mode Go backend, a Next.js app, an Expo mobile app, and an MCP server with 48 tools, all running on DigitalOcean Kubernetes. Along the way it has been an options bot, an AI content generator, a social trading platform, and, this month, a scanner for prediction markets and weather contracts.
I pay the invoice for all of it. I also wrote nearly all of it: 1,903 of the 1,984 commits carry my name.
That makes the git log a decent natural experiment. Same author, same product, same repo, 31 months. For the first 16 months I wrote everything by hand. For the next year, agents opened pull requests. For the last ten weeks, I have paired with Claude Code on almost every commit.
The expected story is “agents made me faster.” They did, a little. The story I did not expect is that agents made measurement cheap enough that I finally did it, and the measurements overturned several things I had been saying out loud, including on this site.
Commits
1,984
Feb 2024 to Sep 12, 2026
Era C co-authored
88%
274 of 313 commits
Phantom trade rows
9,655
Duplicated by one reconciler bug
Overconfidence (pts)
+54.7
Stated confidence vs realized wins
Three eras in one git log

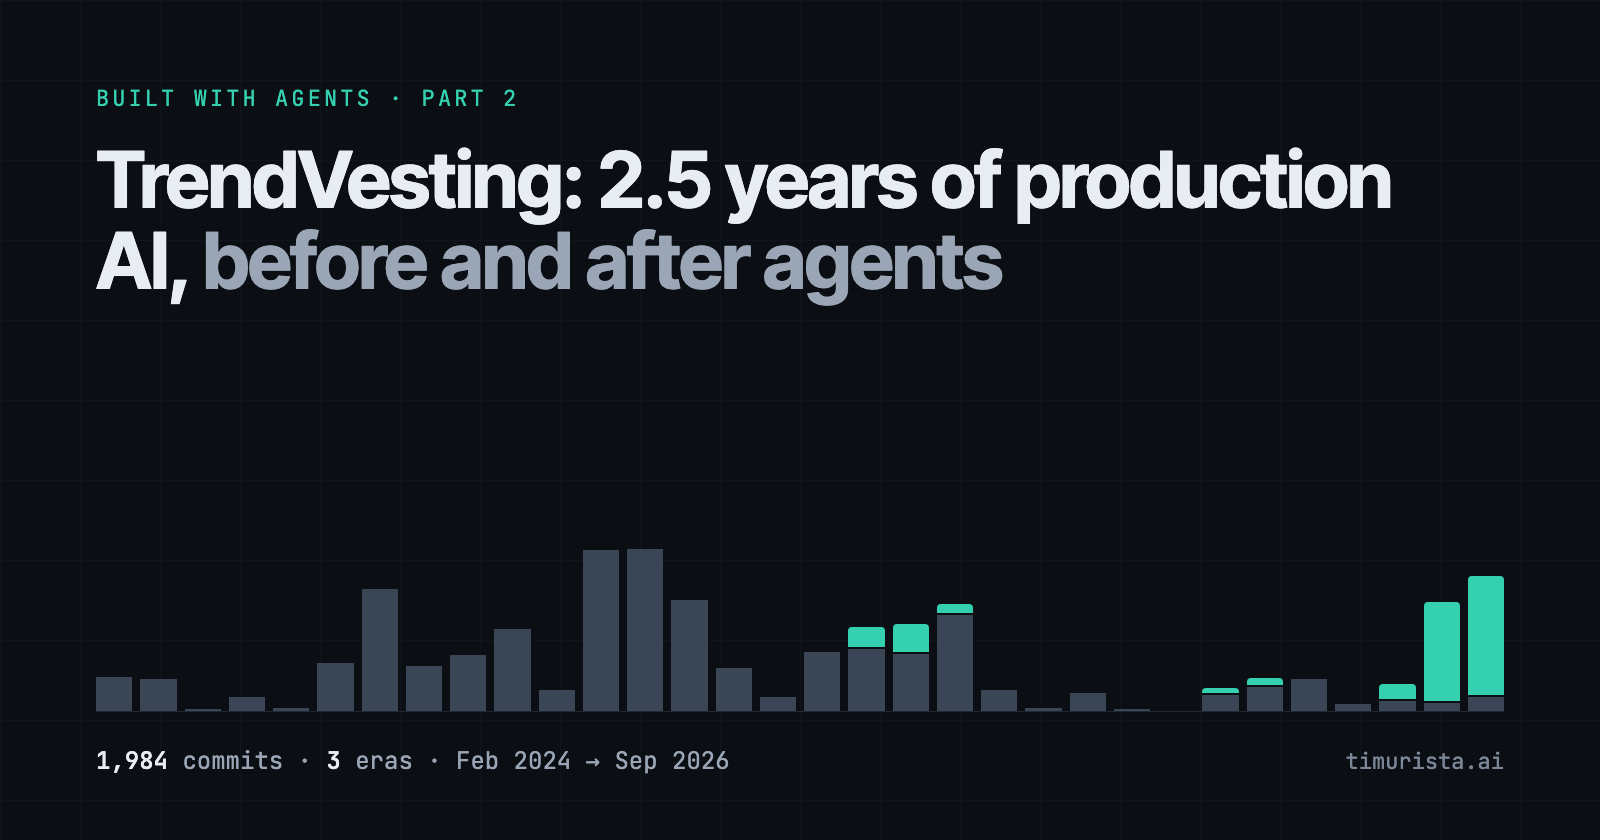
The history splits cleanly into three eras:
- Era A, Feb 2024 to May 2025: solo. 1,121 commits and not one agent. The peak was 190 and 191 commits in January and February 2025, when I was building a social trading platform on nights and weekends.
- Era B, Jun 2025 to Jun 2026: bot PRs. 550 commits. The first Codex PR merged on June 21, 2025. Copilot’s coding agent and
claude[bot]showed up in July. 67 commits were authored by bots. Then came a long lull: 25, 4, 21, 2 and 0 commits from October through February. - Era C, Jul 2026 to now: pairing with Claude Code. 313 commits, 274 of them co-authored with Claude. That includes 157 in the first 12 days of September.
The honest read on velocity: August 2026 (126 commits) is below my manual peak. Agents did not turn me into a ten-person team. What they changed is harder to see in a bar chart.
”fix it,” 108 times

In Era A, my most common commit message was fix it. Exactly that, 81 times, plus 27 more in Era B. Some of the others are not printable on a consulting website. The median subject line was 19 characters and 5% of commits had a body at all.
In Era C, 86% of commits have a body, averaging 135 words. A typical one is 01871ae Stop the options reconciler duplicating closed trades, and defend the read path , followed by about 30 lines: the root cause, the numbers from production, what the fix deliberately does not do, and how it was verified.
This is not about prettier logs. The commit body is where the agent writes down what it measured before it changed anything. I ask for that, and I review it like a small design doc. Since September 9, 68 commits also carry a Claude-Session link, so any line of code traces back to the conversation that produced it.
What I was building, briefly
TrendVesting has pivoted more than I’d like to admit: equities, then options, then an AI content bot (one December commit reads “we dont have access yet so try o1-mini”), then a social trading platform, a Python “Room of Experts” service now on hold, a high-yield ETF agent, Polymarket and Kalshi arbitrage, and this week, weather markets.
Each pivot kept the plumbing (Go, Postgres, Kubernetes) and swapped the thesis. Old tables kept filling up, and every dashboard kept summing them. Nobody checked those sums, and I was the only nobody.
9,655 trades that never happened
The data-integrity week started with a small question: had one options agent recorded a May 26 exit? The answer, from the commit: “It is recorded about 170 times.”
The reconciler creates a trade row when the broker reports a position it cannot match. Its duplicate guard only looked for status = "open" trades, while the comment above it said “even closed ones.” Once a trade closed, the position looked orphaned again, and the reconciler minted another closed row, roughly once a minute.
Across the options agents: 9,655 closed rows for 312 signals, summing to −$4,836,144. The 510 rows with a real exit order summed to about +$81,000.
The fix corrected the writer and added a read-side repair that collapses duplicates to the row with a real exit order. It did not delete anything, and the commit says why: “Deleting trade records is destructive and belongs in a separate, explicitly approved step.” That sentence was written in a pairing session, and I want it as policy for every agent that touches production data.
114 losses filed as target hits
Two days later: 685b5bf stop recording losing option exits as target hits .
Two code paths close an options trade. One of them refused to label a losing close as a “target” hit. The other, used when a position vanishes and the exit order is looked up after the fact, labelled any filled exit order a target hit. But a stop-loss is also an exit order, and in practice it was usually the one that filled.
Result: 114 rows and −$60,155 of losses recorded as target hits, from April 27 to August 13, 2026. The commit put it better than I would have: “A strategy that reports its stop-outs as target hits cannot be evaluated: win rate, average win, payoff ratio and expectancy are all wrong, and wrong in the flattering direction.”
The follow-up, 56d1888 stop deriving a trade’s exit price from its exit label , removed code that would have valued a “target” trade at its target price whenever the real fill was missing. It never fired. It was, in the commit’s words, “one missing fill away from firing.” It is now an invariant test: for the same prices, every exit reason must produce the same exit price.
A confidence score that predicted nothing
A signal gets created when the model’s stated confidence clears a bar. On September 10, I raised that bar from 70 to 75 ( ccf56f5 raise the confidence bar from 70 to 75 ) because “the model now routinely scores in the 80s.”
The next day we checked whether confidence meant anything. Both facts had been stored for months, the confidence in one table and the eventual win or stop in another. Nothing had ever joined them. 47f21e0 check whether model confidence predicts a win did, against 573 resolved signals in production:

Win rate is flat at every bar, and stated confidence runs 54.7 points above the realized rate. So the number neither ranks signals (raising the bar filters nothing useful) nor means what it says (88% confident wins about a third of the time). The bar I had raised the day before was a knob connected to nothing.
The first version of the tool failed in an instructive way. It split signals at the median confidence, but 62% of them sit in a single 90 to 95 bucket, so the split degenerated and the tool reported “not enough data to say” on 573 signals. As the commit says: “It read as a sample-size problem and was a logic bug.” An agent that trusted its own first output would have stopped there.
This was not the first warning. In August I found a prompt template that computed the decision in code and told the model to “output EXACTLY the JSON below.” The model had been rubber-stamping a pre-baked HOLD, including “a 93%-confident ‘do nothing’” ( 7019913 LLM owns the decision; safety vetoes stay hard ). Model confidence in that pipeline had been decoration for a while.
The market was right, and my spot feed was frozen
The prediction-market work produced the same lesson faster. Version 1 of a fair-value model for Kalshi crypto contracts looked like it had an edge. It did not. The edge came from “one bull afternoon plus a stale spot feed”: BTC spot came from a candles endpoint that sat frozen, so the model was buying against old prices. In a 24-hour paper sample, contracts it bought YES on resolved YES only about 18% of the time (33 of 187).
After fixing the feed and sweeping parameters, a log-loss fit over about 4,200 settled observations settled the question: the market scored 0.343, the model 0.493. Lower is better. The market was the better forecaster, and the strategy doc was rewritten to lead with that ( 4539be0 market-is-efficient finding ). This is not trading advice. It is a reminder that “the model has an edge” and “the model is reading a frozen number” look identical on a dashboard until someone computes a proper score.
Stop reporting a flag as a fact
The weather work gave me my favorite commit title of the year: 31e6253 collect the settlement side, and stop reporting a flag as a fact .
The admin screen said weather data collection was disabled. In fact the archive was growing normally: 294 forecasts, 127 readings, last write minutes old. The status endpoint was mounted in two processes and read an environment flag from whichever one answered. The API pod never had the flag set.
The second fault was worse. We were archiving forecasts but never the actual observed highs. A model needs forecast and actual pairs, so usable training data “numbered zero and would have stayed zero however many days accrued.” Nothing alerted on it, because “every check watched for calls that failed, not for a series nobody asked for.”
Status is now derived from the archive itself, and readiness reports the minimum across gates, because “300 forecasts and no actuals is 0% complete, and an average would have rendered that as half done.”

My cost-per-signal number, revisited
Until this week, this site quoted TrendVesting at ”~$1.50–2.00 fully loaded per signal.” That number comes from a cost ledger I drafted in July 2026. Here is how it was built, and what survives this month.
The monthly lines came from invoices and dashboards, plus GitHub and Copilot at about $74 and managed Postgres at about $15. One 30-day OpenAI window showed $59.17 for 117.9M tokens across 43,470 requests.
Kubernetes / mo
~$160
Market data / mo
~$100
OpenAI / mo
$60–100
All in / mo
$400–500
July 2026 estimate

What survives: the shape of the bill. The cluster alone costs more than the tokens. The expensive part of production AI is the production part.
What does not:
- That same draft said monthly hit rates were 73% in April, 63% in May and 66% in June. I cannot reproduce those from anything in the repo. The first real join of signals to outcomes found about 34% across 573 resolved signals. Definitions could account for some of the gap. Either way, I published a quality number I had never measured the way I now would.
- The per-signal math divided the bill by “a few hundred tracked signals per month.” That was an estimate, not a count.
- Every P&L-based view of quality in that period sat on a table with 9,655 duplicate rows in it.
So $1.50 to $2.00 is, at best, a rough cost per signal generated. It says nothing about cost per signal worth acting on. As arithmetic, not a measurement: if about a third of signals win, the cost per winning signal is roughly three times higher, before anyone asks whether the wins pay for the losses.
The cost controls that held up
The unglamorous cost work did hold up, mostly because each fix started from a number:
- LLM only when a cheap check trips (
fd6f4f8signal-watcher re-evaluation mode ). A price, sentiment or time check must fire first. “A due signal with no trigger is just stamped (no LLM).” Calls are capped per signal and run on gpt-5-nano instead of gpt-5-mini. - A throttle that survives restarts (
c875f3athrottle tax-estimation LLM to once/day ). The “once a day” guard lived in memory and reset on every deploy, so the prompt fired many times a day. It now lives in the database. - Turning off a paid button (
2f6b54cdisable paid SnapTrade manual refresh ). About 340 paid refreshes a month, roughly $17. The free cached snapshot is now the default. - Caches that show their age (
d227ec5show how fresh the numbers are ). “Being a minute behind is fine on financial numbers when you can see that you are; being a minute behind silently is not.” - A circuit breaker (
3fa974dskip Alpaca after repeated failures ). During a market-data outage, one endpoint took 54.7 seconds waiting on timeouts before falling back.
None of this is clever. Each fix started with a number: 340 clicks, 54.7 seconds, “many times a day.” Agents are good at going and getting that number. I was bad at stopping to get it myself.
How the agents are fenced in
More measurement means more agent access to production, so the guardrails matter more than the prompts:
- One source of truth.
CLAUDE.mdis canonical.AGENTS.mdis a 17-line pointer that defers to it “so the two guides can’t drift out of sync.” - Trading gates in layers. For Kalshi: no credentials means disabled,
ARB_TRADING_ENABLEDmust be set, the environment defaults to the demo sandbox, orders are capped server-side, and MCP order tools only preview unless called withconfirm=true. - Humans on anything live. An AI reviewer can auto-confirm market pairs for paper scanning only. Human confirmation remains the bar for live trading.
- Destructive fixes wait for approval. Stops may only be tightened, never widened.
- Skills and permissions. Two skills (PRs and migrations), an
@claudeGitHub Action, and a local allowlist of 169 rules. That last number is higher than it should be, which is a story for Part 4.
What this means if you run AI in production
Agents raised my velocity a modest amount. The bigger change is that asking “is that actually true?” went from an afternoon of SQL I kept putting off to one prompt and a reviewed commit. When I finally asked, the answer was “no” more often than I would like.
I have spent my career on some version of this problem. At Roku it was attributing AWS spend. At Apple it is financial attribution across a very large server fleet. Nobody owns a cost they can’t see, and it turns out nobody owns a quality number they have never joined against an outcome.
If you run AI in production, here is the checklist I had to run on myself:
- Join stated confidence to outcomes. If you gate on a model score, check that higher scores actually win more.
- Audit your reconciliation paths. Duplicates and flattering labels tend to hide in the code that runs “after the fact.”
- Make labels unable to change numbers. Write an invariant test for it.
- Derive status from data, not from flags. And alert on the series nobody asked for.
- Give cost per unit a counted denominator and a measured outcome. Otherwise it is a talking point, not a metric.
Most AI cost and quality numbers I see have never been checked this way. Mine hadn’t either. If you want someone to run this audit on your system, that is what I do.
Previously in this series: TendForm: 176 commits, 85% co-authored by an agent. Next: TigerMill: an AI content factory in 33 hours.