unalloc: checking a cost-attribution tool before anyone quotes its numbers
How I scoped and checked unalloc, an open-source tool that joins Kubernetes and LLM provider bills: nine defects caught before release, a budget-capped H100 run with a verified teardown, a paper build that refuses silent typos, and a headline I softened because no meter is ground truth.
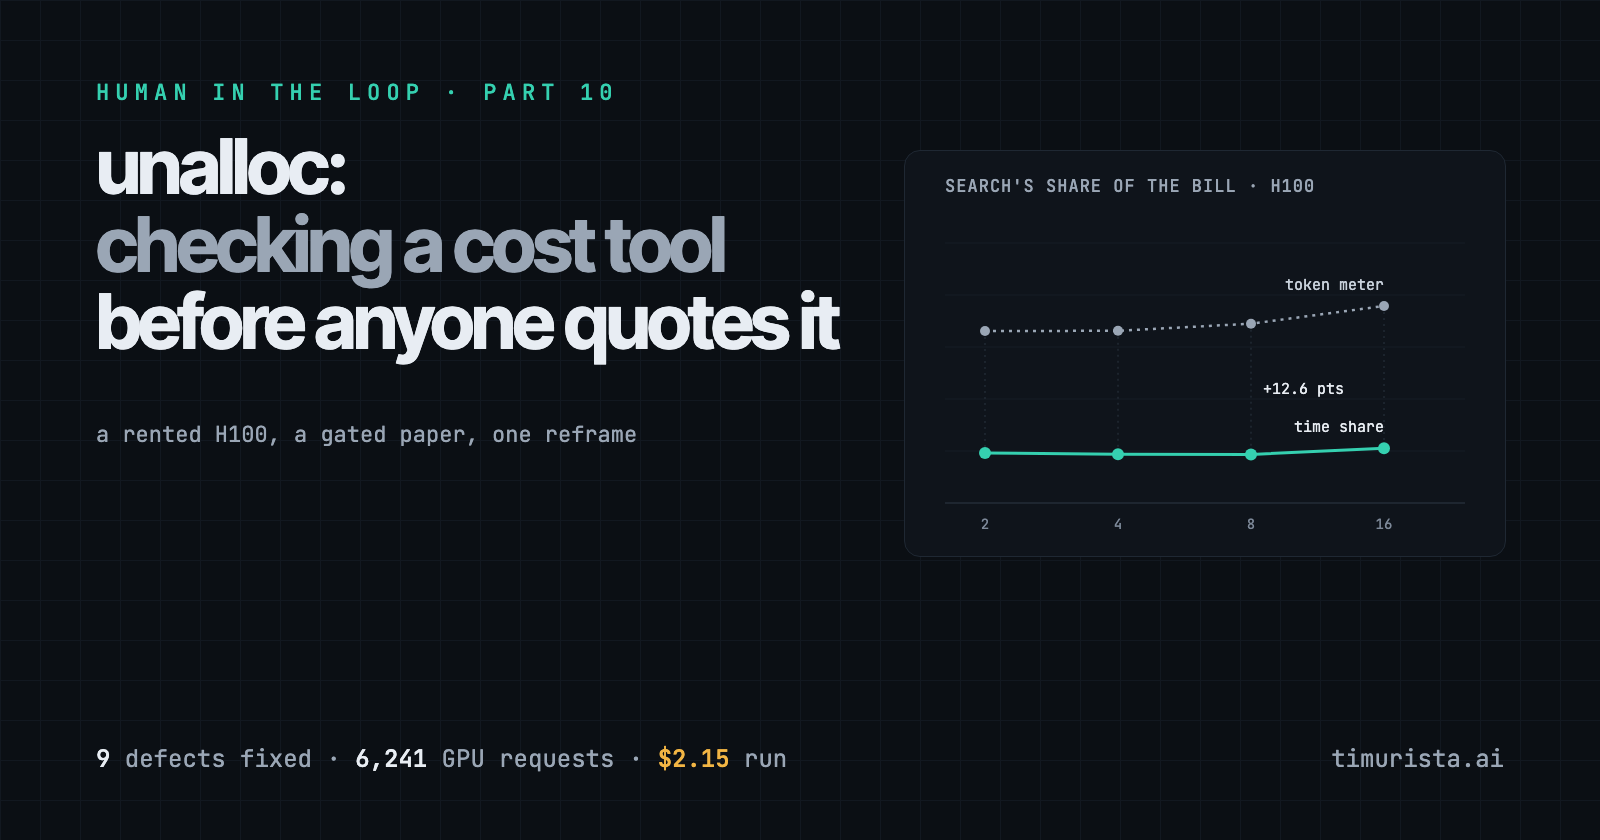
On this page
- The seam nobody owns
- What I scoped in, and out
- Nine defects, and what caught each
- A smaller number that was worse
- Why a CPU result wasn’t enough
- Renting an H100, with the teardown planned first
- What the H100 said
- Guarding the paper itself
- Disclosure, and what the tools were allowed to touch
- What I didn’t check
- A checklist for teams attributing AI spend
At a glance
- unalloc is an open-source CLI that joins OpenCost allocations with LiteLLM, OpenAI and Anthropic bills and reports the AI spend nobody owns. It went from first commit to a 0.2.1 release, a paper, a Zenodo DOI and a project site in 17 commits over two days.
- Nine defects were fixed before 0.2.0, each with a regression test. The worst three broke every live billing fetch, and the unit tests passed through them because they only parsed fixtures.
- A CPU experiment said two metering rules disagreed by 33 points on one team's bill. I didn't want that number standing alone, so the tool was checked on a rented H100: 29 minutes, about $2.15, with a one-hour cap, a watchdog and a teardown verified by resource ID.
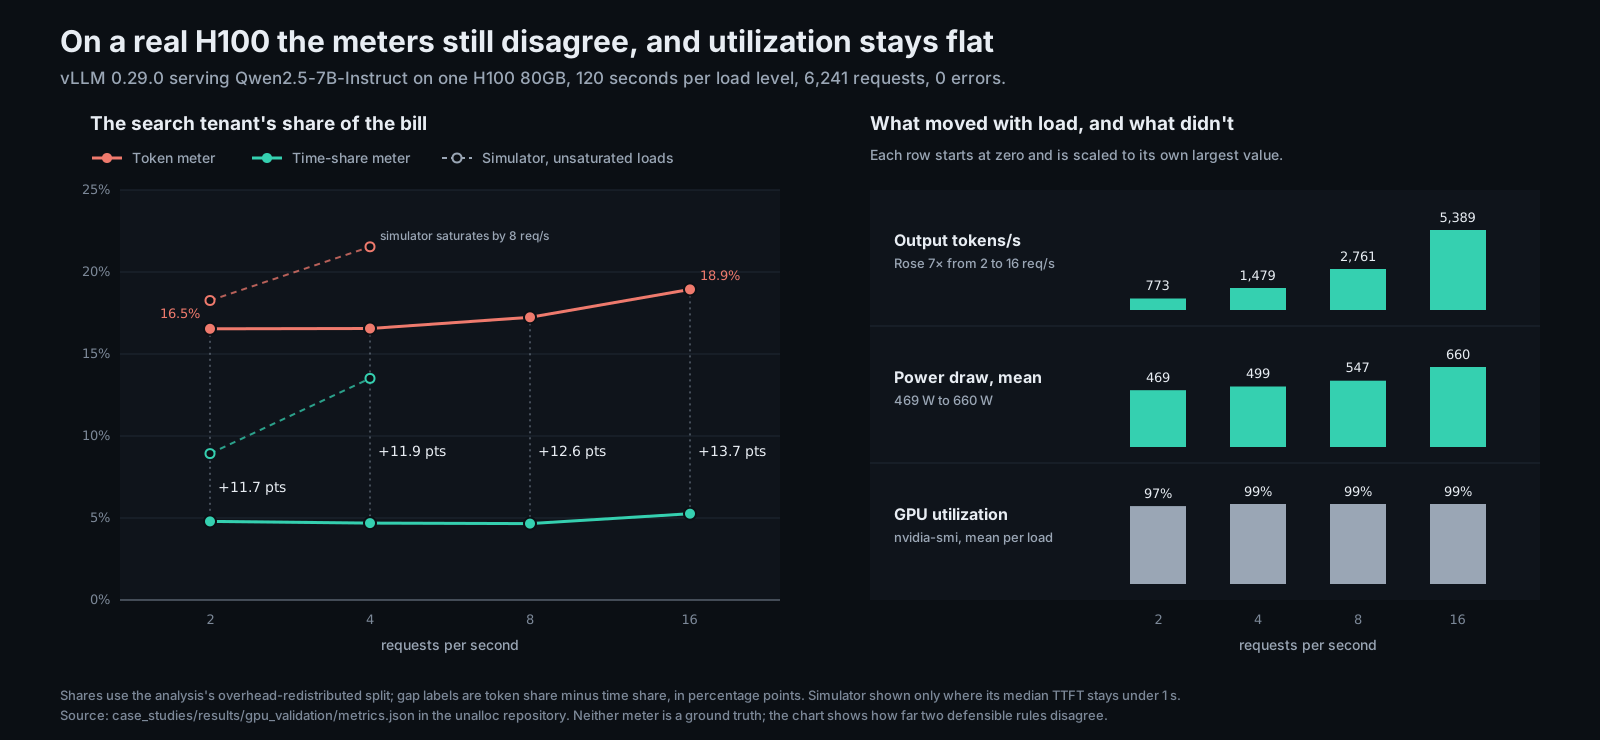
- On the GPU the rules still disagreed, by 11.7 to 13.7 points, and nvidia-smi read 97–99% utilization while throughput rose 7×. The simulator's latency model turned out too pessimistic, and the paper says so.
- The paper got its own gates: a build that refuses Typst that compiles but renders wrong, which caught six lost approximation signs in the 0.2.0 PDF, and a reframe from 'over-charging' to 'the rules disagree', because neither meter is ground truth.
A cost number is a claim about who should pay. If a tool says a third of your AI spend has no owner, someone will carry that into a budget meeting, and the first question in the room will be whether it’s right. So a cost-attribution tool’s numbers have to survive someone checking them.
unalloc is my open-source answer to one narrow version of the ownership question. This is Part 10 of Human in the Loop. It covers how I scoped the tool, what I required before a number could appear in the README or the paper, and what the checks turned up.
The work was AI-assisted, and the paper says so in a short statement at the end. I’ll come back to that, because the disclosure belongs with the checks rather than in a footnote.
Defects fixed before 0.2.0
9
Each with a regression test
H100 requests
6,241
0 errors from 2 to 16 req/s
GPU validation run
$2.15
29 minutes at $4.41 an hour
Tests passing
39
Clean install; 3 more need research extras
The seam nobody owns
OpenCost tells you what Kubernetes workloads cost. The provider consoles tell you what API calls cost. A retrieval feature uses both: a vector database and a self-hosted model on the cluster, and a frontier model behind a LiteLLM gateway. Neither system can say what the feature costs, and neither can say how much of the month belongs to nobody.
unalloc pulls OpenCost allocations, LiteLLM spend logs, and the OpenAI and Anthropic organization cost APIs into one ledger. It canonicalizes labels so that label_costCenter, team_id and a team:platform request tag can join, then groups the result on whichever label you say means “owner.”
There’s a second, harder layer. When several teams share one inference server, nothing on the invoice splits the bill for you. Someone has to pick a metering rule: raw tokens, tokens weighted by list price, measured compute time, or KV-cache memory, the GPU memory a server holds for each request’s context. That’s what I mean by cost inference here: inferring each tenant’s share of a shared pod from what the server actually did. How far those rules disagree is the paper’s central question.
What I scoped in, and out
The first commit’s README already drew the boundaries, where they’d be hard to expand quietly:
- Not a dashboard. It prints a number and exits.
- Not an optimizer. It makes no rightsizing or commitment recommendations.
- Not a collector. It queries systems you already run and stores nothing: no database, no state directory, no cached credentials.
- Not a second OpenCost. OpenCost 1.121.0 added inference cost tracking for vLLM and llm-d. Those rows arrive through the same allocation API and land in the ledger tagged
unalloc_layer=inference.
Two design rules came with the scope. Money is Decimal, never float, because a cent of drift per row is how you lose an argument with finance. And the result must never depend on the order a provider happens to serialize its labels in. Both turned out to be broken in the first version, which is why you write rules down: then you can check the code against them.
Nine defects, and what caught each
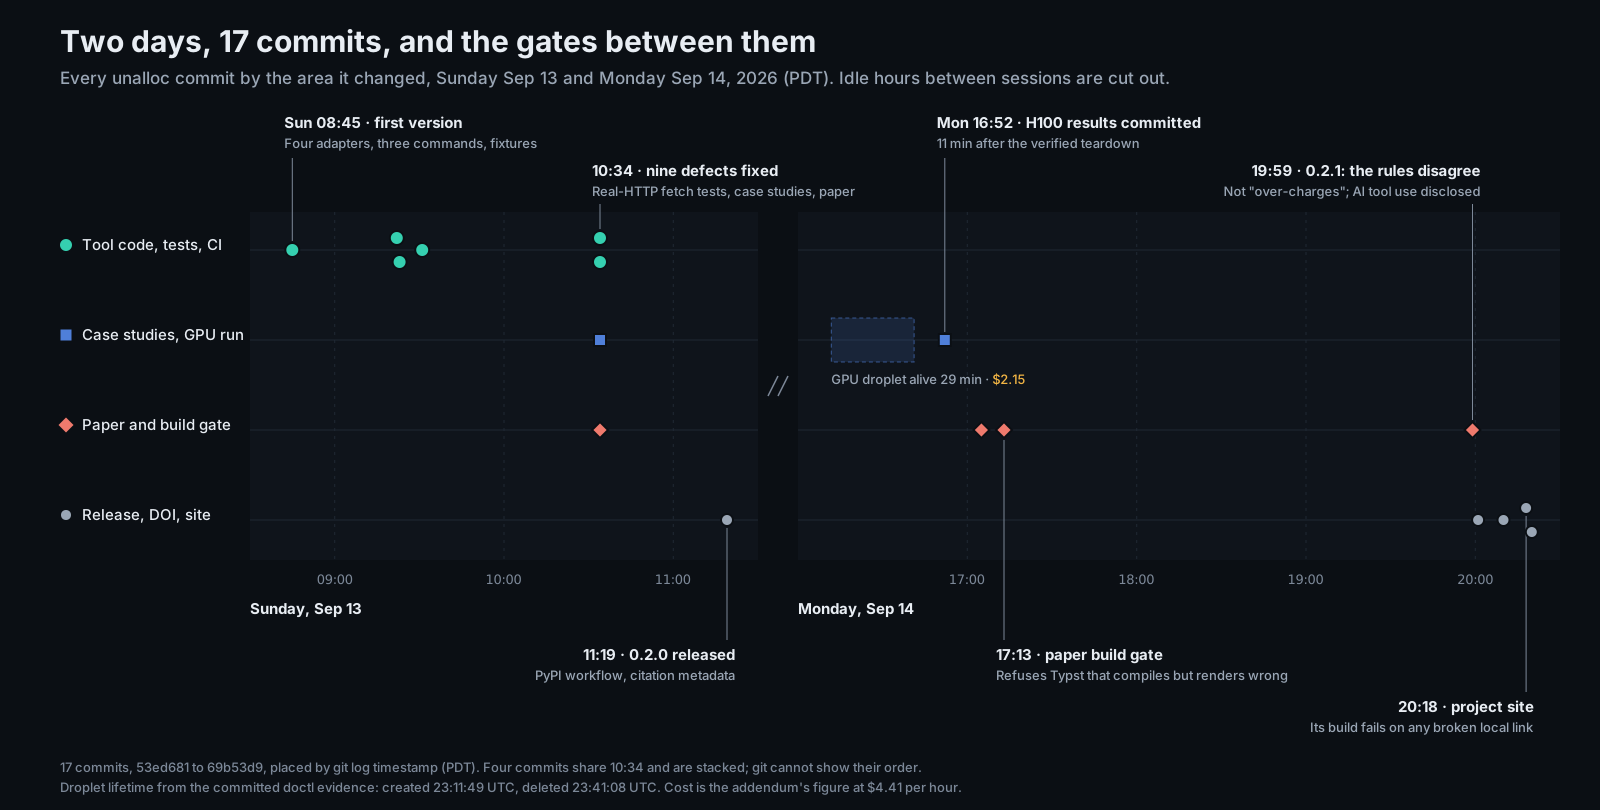
From the first commit to f12bda7 the project site going up took 17 commits, from Sunday at 08:45 to Monday at 20:20. 53ed681 The first version shipped four adapters, three commands and bundled fixtures.
Thirty-eight minutes later came the first fix. The fixtures were found by walking up two parent directories, which only works in a clone. Installed from a wheel, every adapter silently skipped and the demo printed nothing. 26a3840 Ship fixtures inside the package moved them, and added make check-wheel to CI. That target builds the wheel, installs it into a throwaway virtualenv, and runs the demo.
Then came 2876321 the case studies , run in CI by c281491 a case-study job , and a longer list. The paper’s Appendix A catalogues nine defects in the tool, all fixed in bbaad88 live fetch paths, deterministic label canonicalization, fallback reporting . It also records what caught each one.
- Review, then confirmed end to end (3). The OpenAI and Anthropic adapters lost their default URLs whenever the CLI passed an unset environment variable, so every live fetch failed. The Anthropic Admin API got a Bearer token instead of
x-api-key. Neither adapter followed pagination, so each read one page, about a quarter of spend. - Review alone (3). OpenCost component costs were summed through
floatwhentotalCostwas absent. Thelabelsbacklog ignored--fallback, so it disagreed withreport. Andlabelsprinted “Nothing unallocated” when no source had loaded at all. - The distributed-inference study (3). Only one provider prefix was stripped from label keys. Colliding canonical keys resolved by arrival order. OpenCost annotations silently overrode labels with the same key.
The fetch-path bugs passed the unit tests, because those tests parsed fixtures and never made a request. The fix added tests/test_fetch.py, which starts a real local HTTP server and asserts on the URL, the auth header and the page cursor the adapter actually sends. One test is the float bug in miniature: a payload with 0.1 and 0.2 must come out as exactly Decimal("0.3"). CI also runs the pure-Python case studies against the real adapters, so a broken fetch path fails there even when unit tests pass.
One gap in the record: the fixes, the case studies and the paper all carry the same 10:34 timestamp, so git can’t show which came first. The appendix is the record of what caught what, and I won’t imply an order the log doesn’t show.
A smaller number that was worse
The distributed study produced the finding I’d put in front of any FinOps team. Multi-host inference on Kubernetes often runs as a LeaderWorkerSet: one leader pod template and one worker template. Teams label the leader and forget the worker.
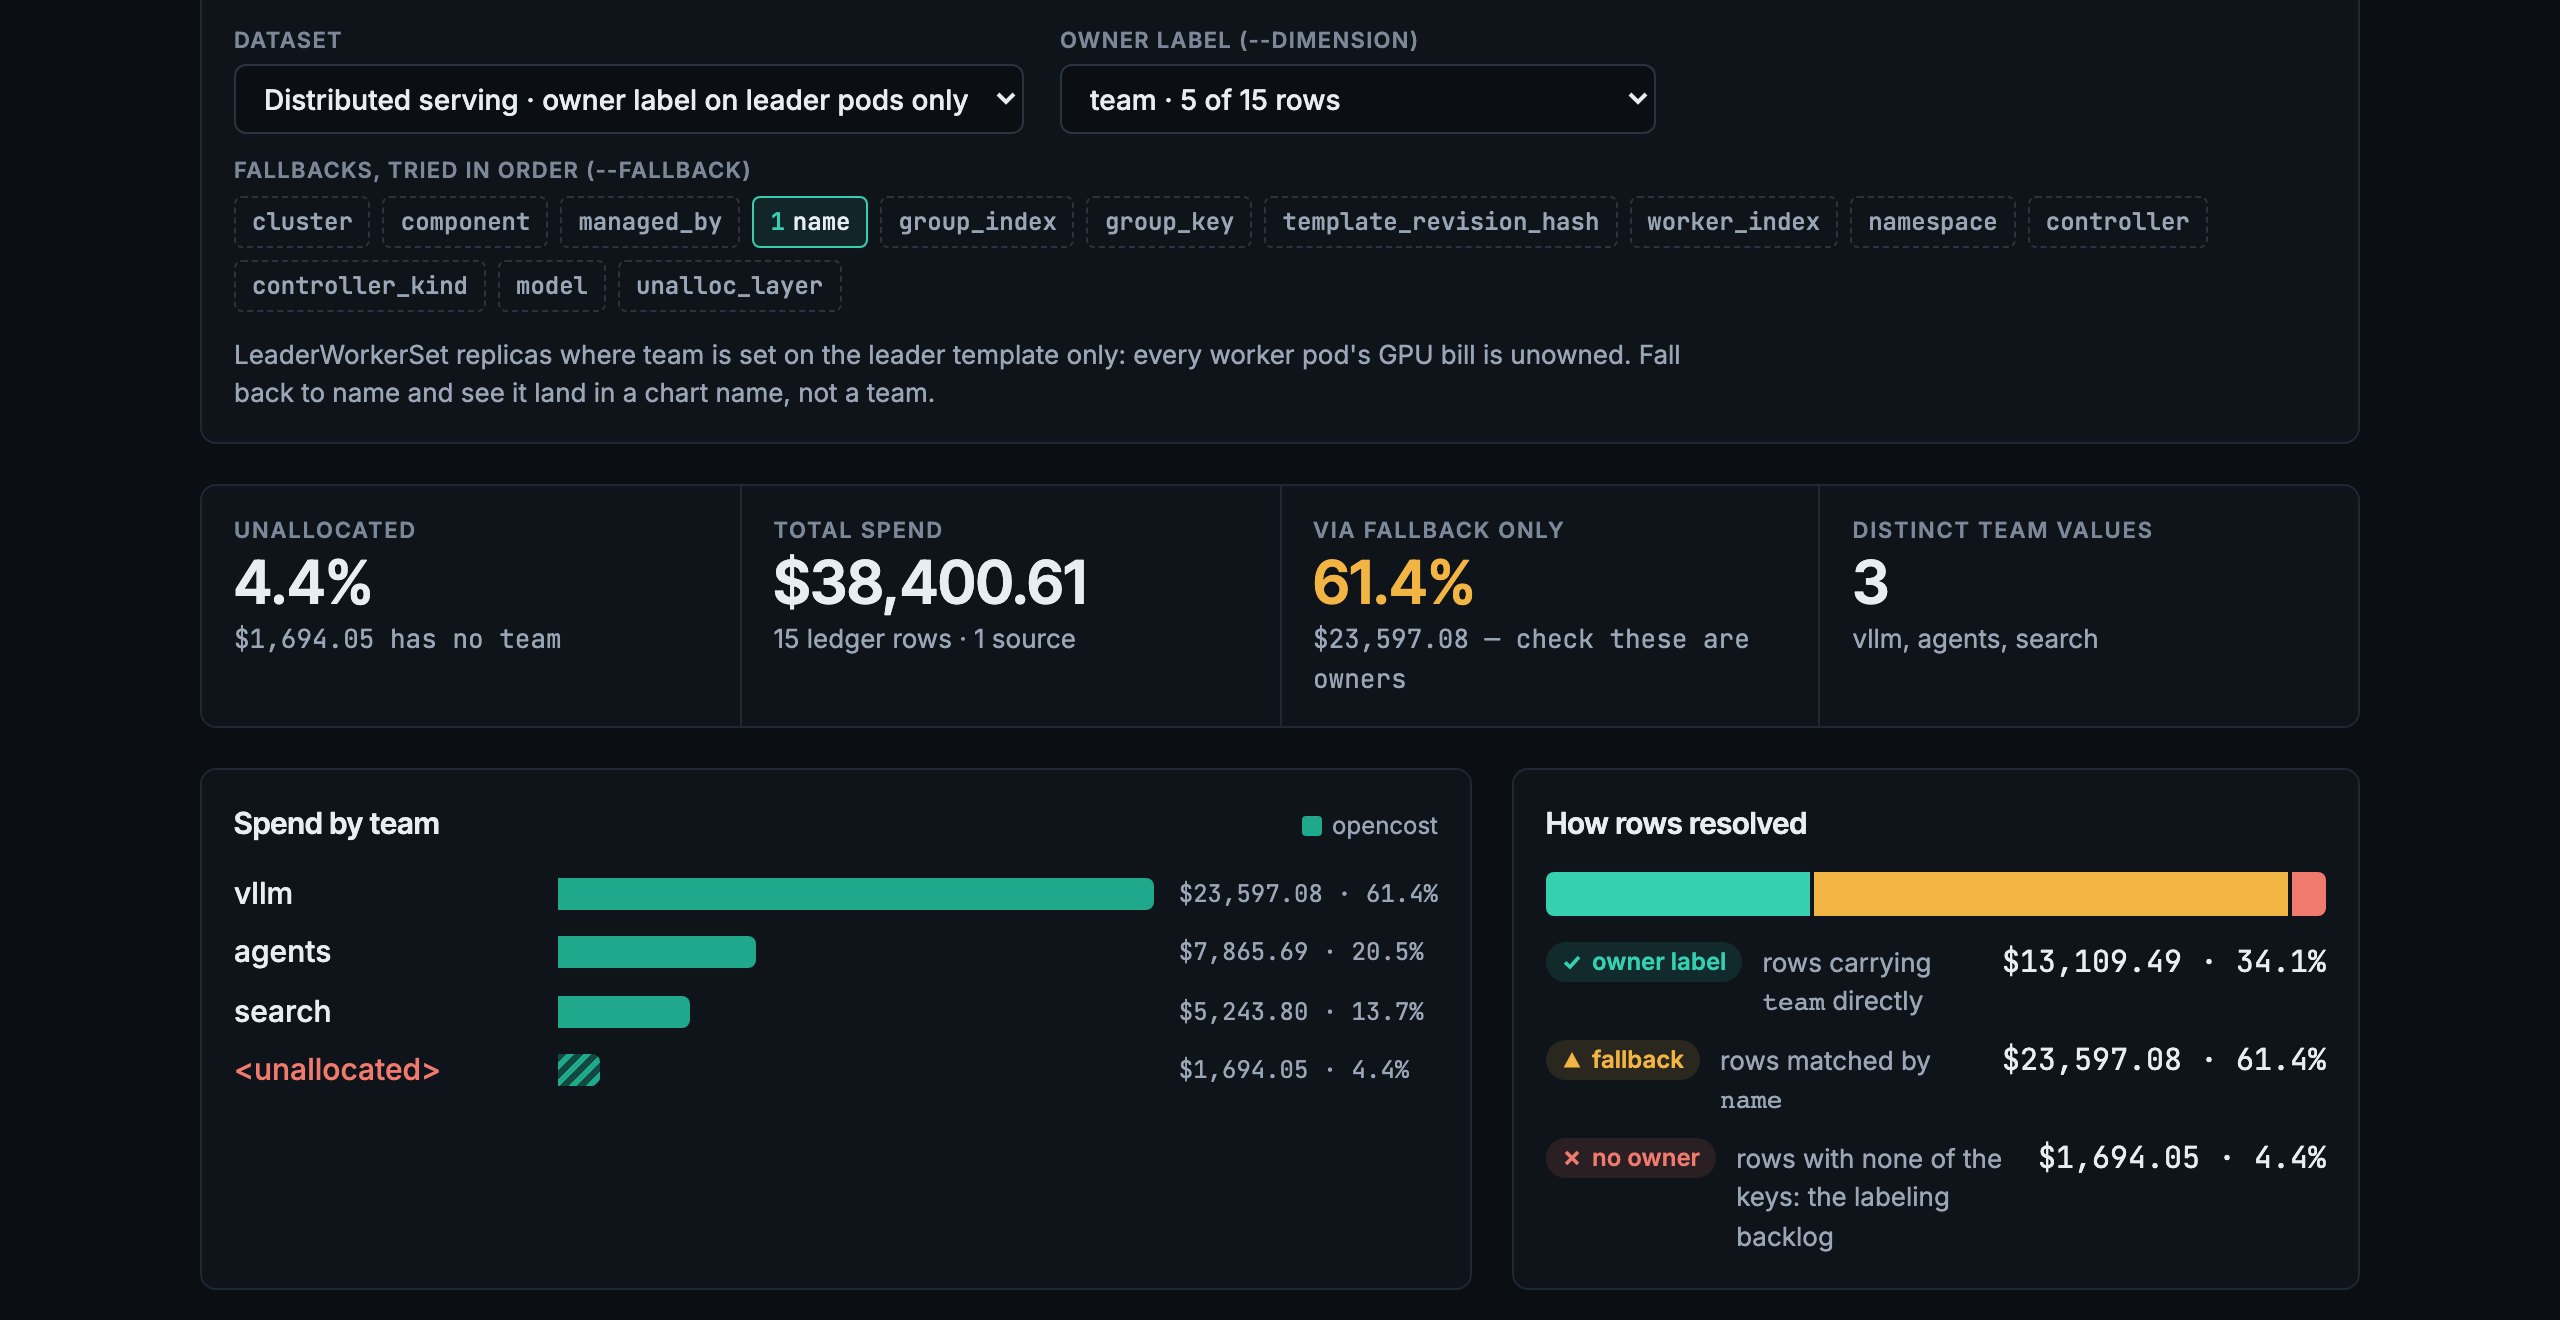
With team on leader pods only, a synthetic $38,400 month was 65.9% unowned. Falling back to name, a label every pod carries, drops unallocated spend to 4.4%. It also puts $23,597.08 (61.4%) into a bucket called vllm. That’s the Helm chart’s name, not a team: app.kubernetes.io/name and leaderworkerset.sigs.k8s.io/name both canonicalize to name.
The headline percentage can’t tell that apart from a correctly labeled cluster. So reports gained a line for spend attributed only through a fallback key (fallback_usd in JSON). The collision fix mattered here too. Before it, the same pod landed in vllm or search-llama-70b depending on JSON key order.
Why a CPU result wasn’t enough
The metering question produced the most quotable number, and the one I trusted least. A small from-scratch PyTorch decoder served a 96-request trace from four tenants on a CPU. search is RAG, with long prompts and short answers. agents has short prompts and long outputs. platform sits in between, and sandbox is a shared key with no owner. By token count, search’s share of the pod was about 45%. By measured compute, it was 12.4%. That’s a 33-point disagreement, or $5,703 of an illustrative $17,280 month.
Two things kept that number from standing alone. A CPU carries a large fixed overhead per decode step, which a batching GPU spreads across requests, so the size was hardware-specific even if the direction was structural. And the vLLM-style simulator used an analytic latency model with hand-set constants. Both were my own code grading my own tool, so the next step was the real thing.
Renting an H100, with the teardown planned first
The runbook starts with a budget: one gpu-h100x1-80gb droplet at $4.41 an hour, capped at one hour. It states the trap in bold, because it’s easy to miss: a powered-off GPU droplet still bills. The only way to stop charges is to delete it.
The gates, in order:
- Test the analysis before paying for data.
test_gpu_validation.pychecks metrics parsing, trace generation and the meters with no GPU and no server. Its docstring puts it plainly: a regression should be “caught before the next rental rather than during it.” - Dry-run for free. A fake vLLM server on a laptop exercised the benchmark client before anything was rented.
- Arm a watchdog at creation. A local background job deletes anything carrying the run’s tag after 55 minutes, whatever else happens.
- Verify the hardware before installing anything, from
nvidia-smi,lscpuand the provider’s own droplet record. The addendum’s spec table comes from those captures, not from a spec sheet. - Measure serving, not the internet. The client ran on the droplet next to the server, and it aborted the sweep if the warm-up saw any error.
- Commit every step’s terminal output, failures included.
Two things went wrong, and both stayed in the record. vLLM 0.29.0’s first start failed while JIT-compiling a FlashInfer sampling kernel on the provider’s image. Setting VLLM_USE_FLASHINFER_SAMPLER=0 falls back to a PyTorch sampler that gives identical results for greedy decoding, and the failed log is committed next to the good one. Then teardown: deleting by tag emptied the tag listing while a lookup by ID still showed the droplet active.
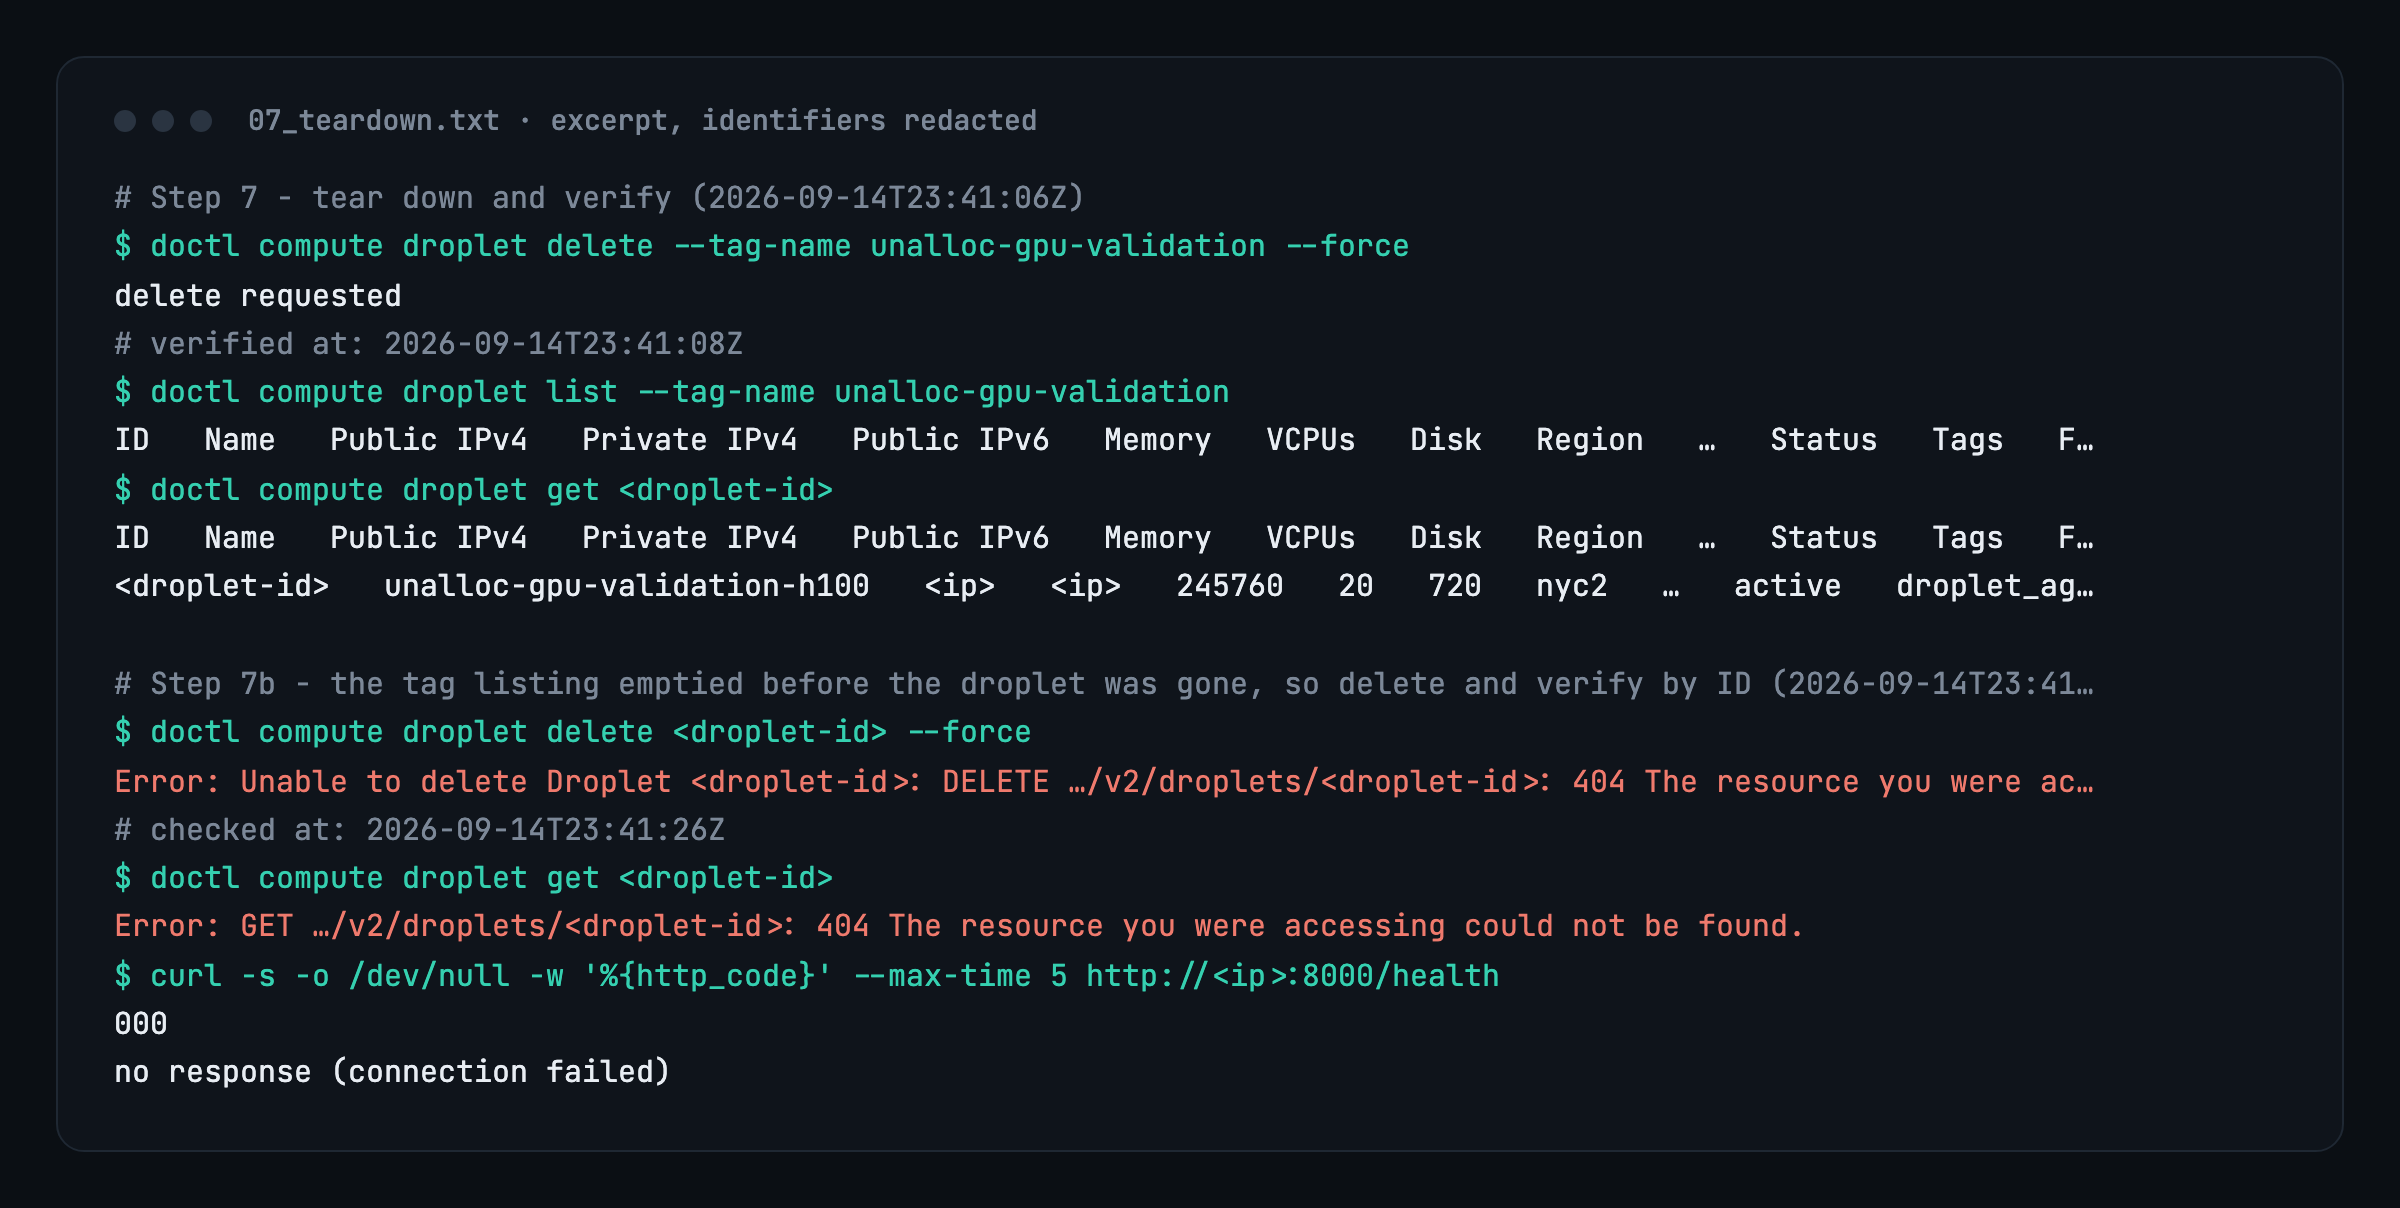
A delete by ID then returned a 404, and the watchdog was only stopped after that. The droplet existed from 23:11:49 to 23:41:08 UTC, 29 minutes, for about $2.15. 0b5a8bb The results commit landed eleven minutes after the verified deletion.
What the H100 said
Points apart
11.7–13.7
Token vs time-share meter, every load
GPU utilization
97–99%
From 2 to 16 req/s
Throughput rise
7×
773 to 5,389 output tokens/s
- The rules still disagree. The token meter put search’s share at 16.5 to 18.9%, and an equal time-share meter put it at about 5%. That’s 11.7 to 13.7 points apart at every load: smaller than the CPU’s 33, in the same direction.
- Utilization isn’t a cost signal.
nvidia-smiread 97% at 2 requests a second and 99% at 16, while output rose from 773 to 5,389 tokens a second. Power tracked the work, from 469 W to 660 W. - The simulator was wrong in one direction. At 2 requests a second it predicted 18.3% against 8.9%: the same direction, roughly the same size. But its latency model saturated by 8 requests a second, while the real server handled 16 with nothing queued. The paper now says to read the simulator’s shares as directional and its latencies as uncalibrated.
A validation run that also shows where your model was off is worth more than one that only confirms. Publishing the miss makes the hit believable.
Guarding the paper itself
A paper is an artifact too, and it can ship with bugs. Two gates went in on Monday.
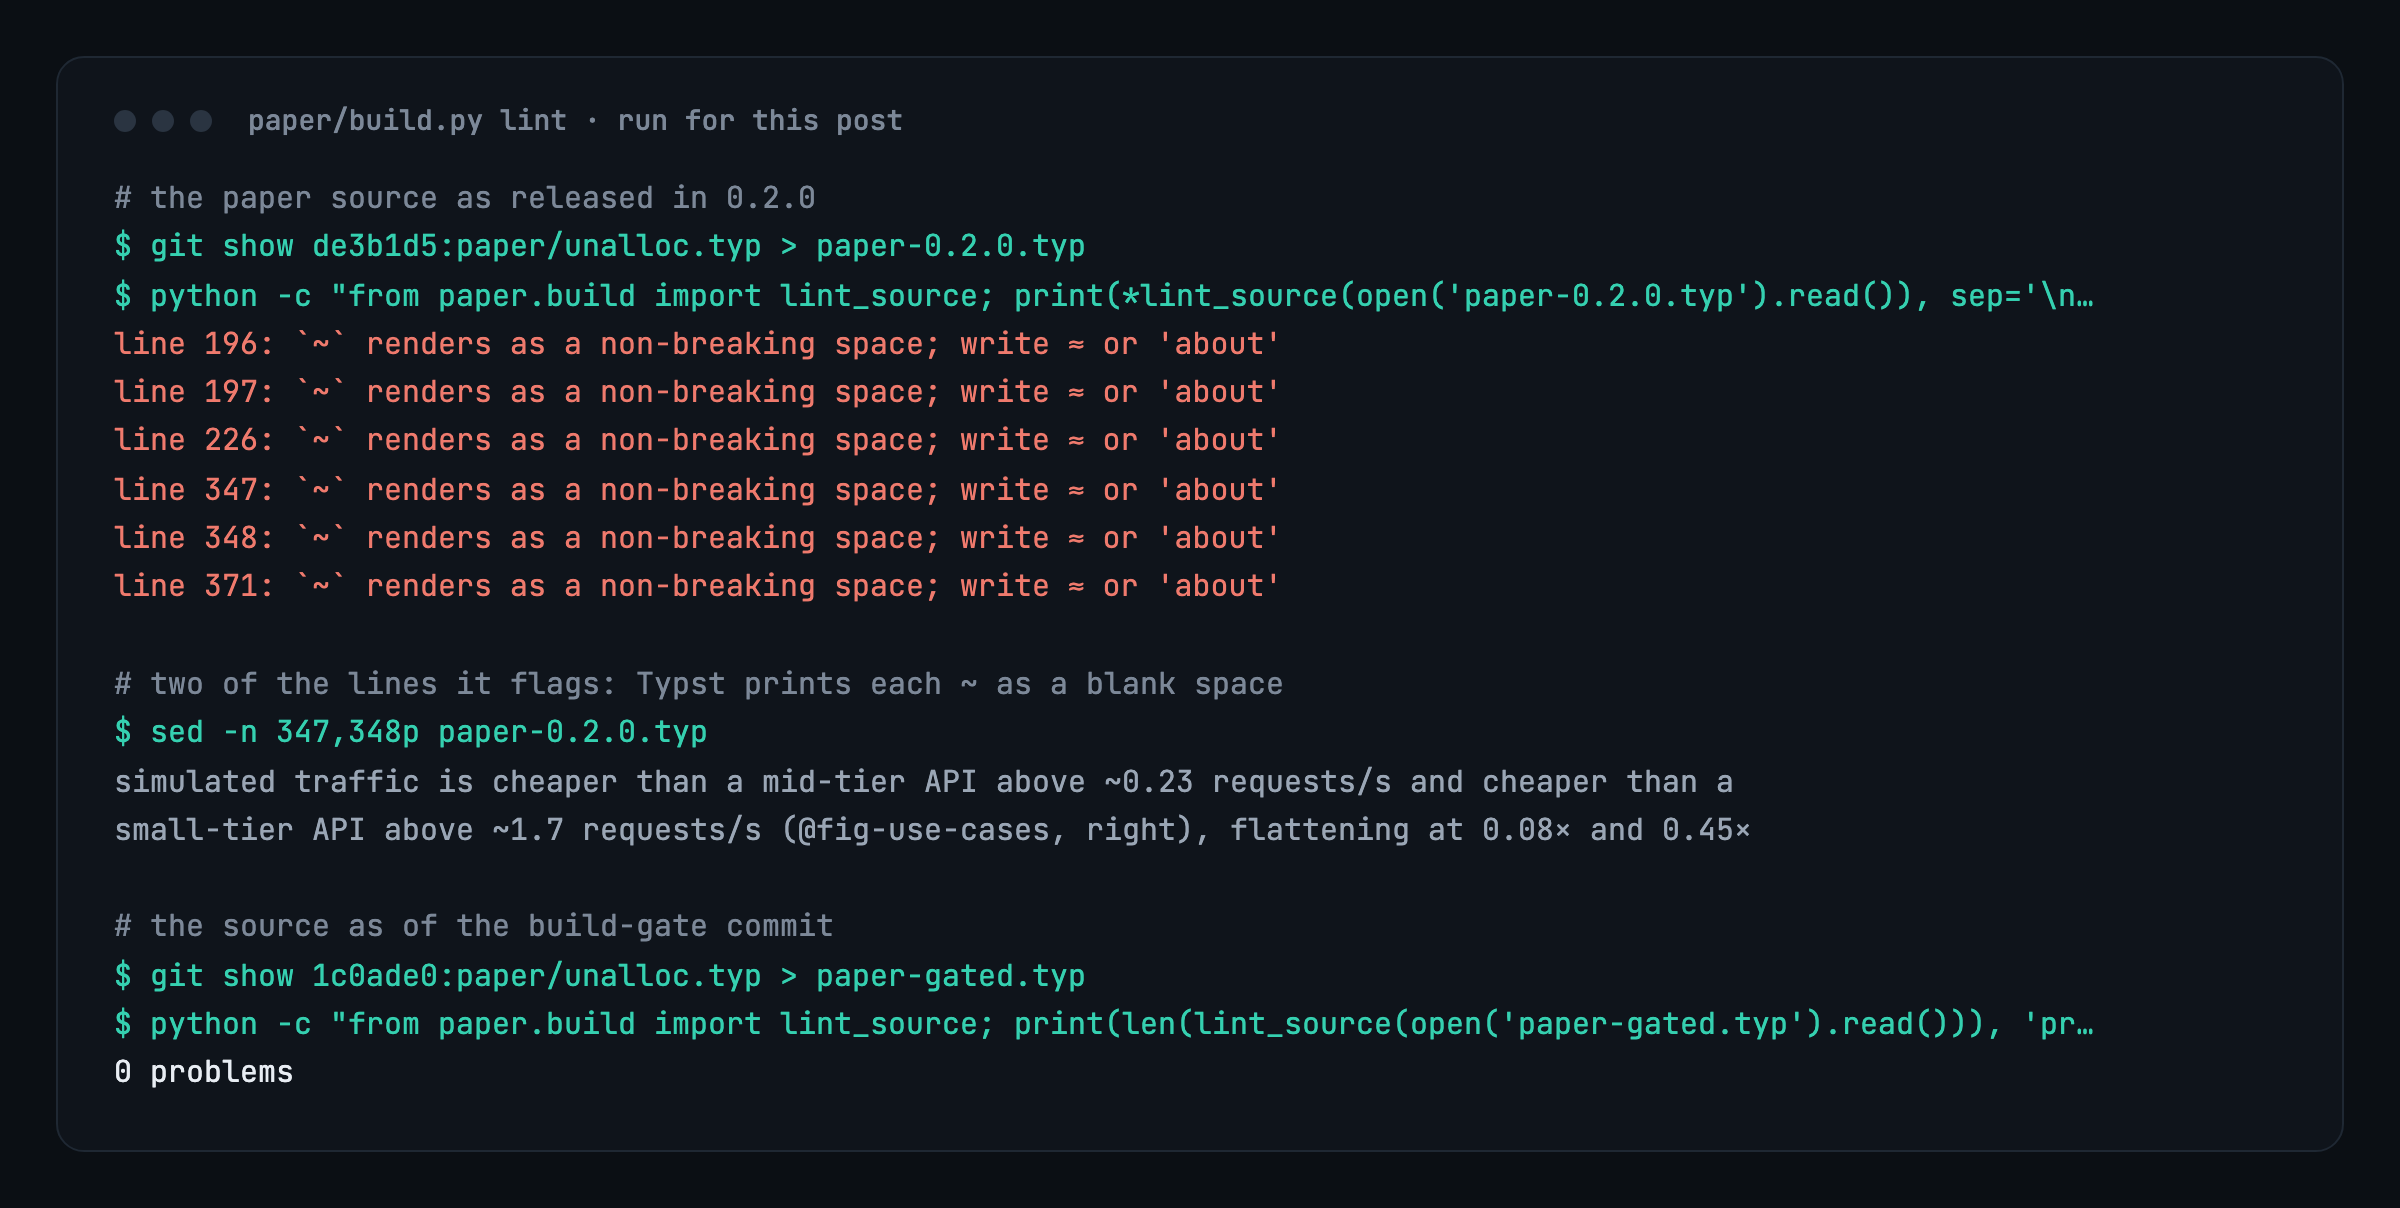
The first is mechanical. Typst, which builds the PDF, accepts ~ and renders it as a non-breaking space. So “above ~0.23 requests/s” printed with a blank where the approximation sign should be, and six approximations lost their sign in the de3b1d5 0.2.0 PDF . 1c0ade0 Fail the paper build on Typst that compiles but renders wrong makes paper/build.py lint the source before compiling. The build exits with line numbers for three constructs: a tilde, a semicolon swallowed after a citation call, and an unescaped dollar amount that opens math mode. The lint skips code and comments, runs without the Typst package so CI can use it, and has its own tests. I ran it against both versions of the source for this post:
The second gate was editorial. The 0.2.0 paper said per-token showback “overcharges the RAG tenant by 33.0 points.” That wording assumes measured compute is the true bill. It isn’t. It’s another defensible rule. In e288de3 release 0.2.1 , the headline became “token counting and measured compute disagree on the RAG tenant’s share by 33.0 points,” and the limitations now open with “No allocation in this paper is a ground truth.”
A new Related Work section names JouleShare, which measures request-level Shapley energy on vLLM, as stronger than this paper on ground truth. The defect catalogue moved to an appendix, because bugs in my tool aren’t findings about attribution.
Disclosure, and what the tools were allowed to touch
The paper ends with a “Use of AI tools” statement: the work was done with Claude Code under my direction, and I’m responsible for all of the content. arXiv asks for that when generative AI is used significantly. I think it belongs with the gates above: a reader deciding how far to trust a number should know how it was produced, and who answers for it.
The submission kit in the repo makes that responsibility concrete. Before submitting: read the whole paper, check each number against the committed metrics.json files, and check that every cited paper says what the text claims it says.
Delegated work also needs a boundary on what it can touch. The committed agent settings allow project-local tooling only: git, make, Python and pytest, ruff, uv, Docker and the CLI itself. During the GPU run, machine-specific approvals from that session leaked into the committed file. de20bf8 Stop publishing personal permissions moved them back to gitignored local settings. An earlier commit to that file has the entire message -s, which is exactly what reading the log is for.
What I didn’t check
- No ground truth. A Shapley allocation by replaying tenant subsets, as JouleShare does for energy, would need 15 subset runs per load level with four tenants. I haven’t run them.
- One GPU, one model, one two-minute run per load, synthetic traffic. Multi-turn prompts append synthetic assistant tokens, so reuse across turns excludes the previous answer.
- Synthetic spend. Prices are round and illustrative, and every dollar figure in the case studies comes from a generated month. That includes the README’s demo report, which runs on bundled fixture data, not a real company’s bill.
- Mocks follow the docs. The mock provider APIs reproduce documented auth and pagination, not every field of a live response. A scrubbed payload from a real deployment would be worth more than every simulated month.
- The reframe didn’t reach everything. The paper and release notes say “disagree,” but the README’s case-study table and the GPU addendum still say token metering “over-charges” search by 12 to 14 points.
- CI covers the pure-Python studies. The PyTorch studies run in the dev container, and on a clean install without the research extras, three tests skip.
- Not on arXiv yet. The paper’s affiliation is still unset, and the kit’s pre-submission checklist is a list of steps, not a record that they were done.
A checklist for teams attributing AI spend
- Write the scope down before the code, including what the tool won’t do.
- Keep money in
Decimalend to end, and test the float path with a real payload. - Put a real HTTP round trip behind every billing adapter: the URL, the auth header and page two.
- Test the installed artifact, not the clone.
- Report fallback-attributed spend separately, and check that fallbacks resolve to owners.
- Choose the metering rule on purpose and name it. Don’t call the difference between two rules over-charging.
- Don’t divide a GPU bill by utilization.
- Before renting hardware, test the analysis offline, dry-run against a fake server, cap the budget, arm a watchdog, and verify deletion by resource ID.
- Gate the write-up like code, and publish the misses next to the hits.
unalloc is on GitHub, and pip install unalloc installs 0.2.1 from PyPI. The paper, blog posts and ledger explorer are on the project site, and every release is archived at doi:10.5281/zenodo.22761012.
If your AI spend is growing faster than your ability to say who owns it, and you want the numbers checked before they reach a budget meeting, that’s the work I do.
Previously in Human in the Loop: timurista.ai: rebuilding this website in a day, with sign-off at every step.