When a weekly rebalance runs every minute: debugging a live ETF agent
A live ETF agent sold 9 shares of SGOV and bought them back once a minute, 183 times in a day. How I found the loop, the four bugs behind it, the fixes and tests, and the diagnostics call that now catches all of them.
On this page
- The agent in one paragraph
- Step 1: Look at the broker, not your database
- Step 2: Count the churn
- Step 3: Find the two functions that fight
- Step 4: Find out why exits never finished
- Step 5: Don’t buy T-bills with borrowed money
- The fixes: five small changes in one commit
- Test it with the incident’s real numbers
- Guard it going forward: one diagnostics call
- What the real numbers say about growth
- Takeaways you can apply to any scheduled job
- Where the numbers come from
At a glance
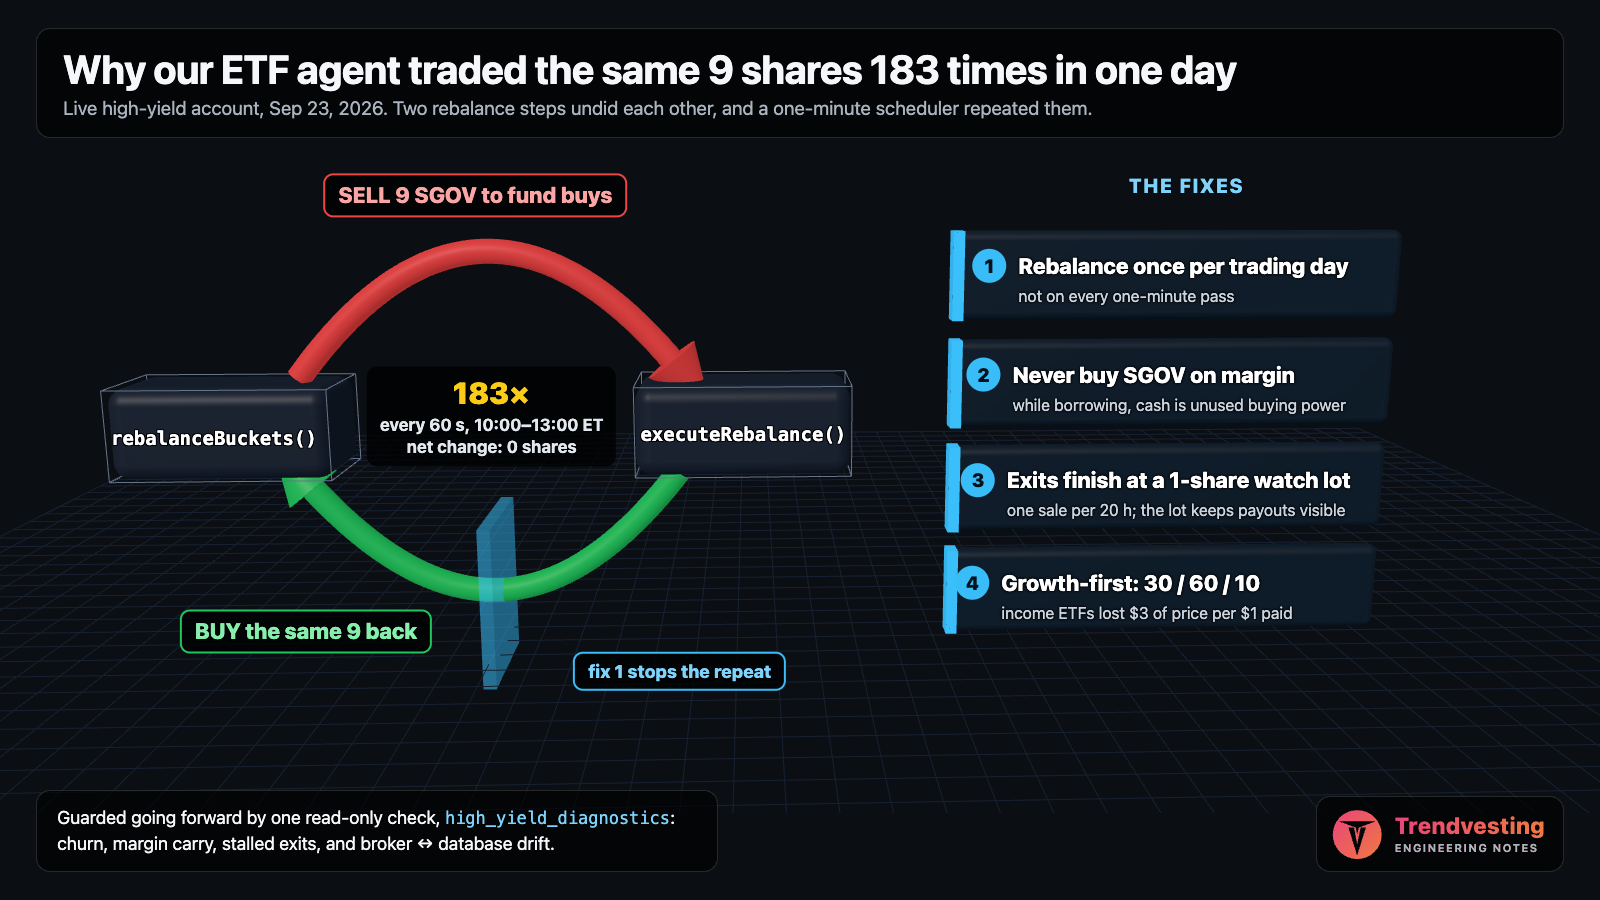
- On September 23, 2026 a live ETF agent sold 9 SGOV shares and bought the same 9 back 183 times, once a minute, and ended the day holding exactly what it started with.
- The cause: a rebalance meant to run weekly ran on every one-minute cycle, and two of its steps each fell back to SGOV, so they undid each other.
- Exits never finished either: a 'sell half' rule re-fired every minute, stalled under a $50 floor, and a decay counter that should count screener runs reached 186.
- The fixes rebalance once per ET trading day, never buy the SGOV cash reserve on margin, end exits at a deliberate 1-share watch lot, and move the defaults to growth-first 30/60/10.
- From the broker's own activity feed, the income ETFs lost about $3 of price for every $1 of income (roughly -$2,000 overall), so the growth weight should follow that measured burn ratio.
My live high-yield ETF agent sold 9 shares of SGOV and bought them straight back, once a minute, for three hours a day. On September 23, 2026 it did that 183 times and ended the day holding exactly what it started with. This tutorial walks through how I found that loop and why it happened. It covers the four other bugs hiding behind it, the fixes and tests, and a diagnostics tool that catches all of them in one call.
You don’t need my codebase to follow along. The failure modes here show up in any scheduled trading job. A job written for one cadence runs at another. Exits that never finish. A trade log that drifts from the broker. Leverage that pays for cash.
SGOV round trips
183
Sep 23, net change 0 shares
Decay counter
186
Meant to count screener runs
Income ETF sleeve
≈ -$2K
Price plus income, May 12 to Sep 25 (rounded)
Checks, one call
7
high_yield_diagnostics
The agent in one paragraph
The agent runs a three-bucket ETF portfolio on a small margin account at Alpaca. The buckets are income ETFs (covered-call funds like MSTY and CRCO), growth ETFs (VGT), and a cash reserve held in SGOV, a Treasury-bill fund. It targets 1.8× leverage. A Go service calls its cycle once a minute. Each cycle syncs holdings from the broker, checks exits, and, on a rebalance day, buys toward the bucket targets.
Step 1: Look at the broker, not your database
The agent’s own tables looked roughly healthy. The broker’s order list did not. Pull recent orders straight from the broker API:
curl -s -H "APCA-API-KEY-ID: $KEY" -H "APCA-API-SECRET-KEY: $SECRET" \
  "https://api.alpaca.markets/v2/orders?status=all&limit=60" | jq '.[] | [.submitted_at, .side, .symbol, .qty] | @tsv'
Every order in the list was SGOV, alternating sell and buy, sixty seconds apart.
Step 2: Count the churn
Next, measure how long it had been going on. The agent logs each order with a reason, so group by day, symbol, side, and reason:
SELECT created_at::date AS d, symbol, side, trade_reason, count(*) AS n,
       min(created_at)::time AS first, max(created_at)::time AS last
FROM agent_high_yield_trades
WHERE trading_agent_id = 8 AND created_at > now() - interval '14 days'
GROUP BY 1, 2, 3, 4
ORDER BY 1 DESC, n DESC;
The pattern was plain: about 180 bucket_rebalance sells and 180 rebalance buys of SGOV on September 22, 23, and 25, each between 10:00 and 13:00 ET. Exits misbehaved too. MARO was sold by decay_exit six times and rally_exit twice in one morning.
Step 3: Find the two functions that fight
The rebalance was meant to be weekly. The config even has TradingDayOfWeek: 2. But the function that gates it ignores that field:
// isRebalanceDay returns true on any weekday (Mon-Fri) so rebalance runs daily
func (hya *HighYieldAgent) isRebalanceDay(config *HighYieldConfig) bool {
    weekday := time.Now().In(et).Weekday()
    return weekday >= time.Monday && weekday <= time.Friday
}
It returns true every weekday, and the cycle runs every minute. So the full rebalance ran every minute. That alone only wastes API calls. It turns into a loop because two steps of the rebalance undo each other:
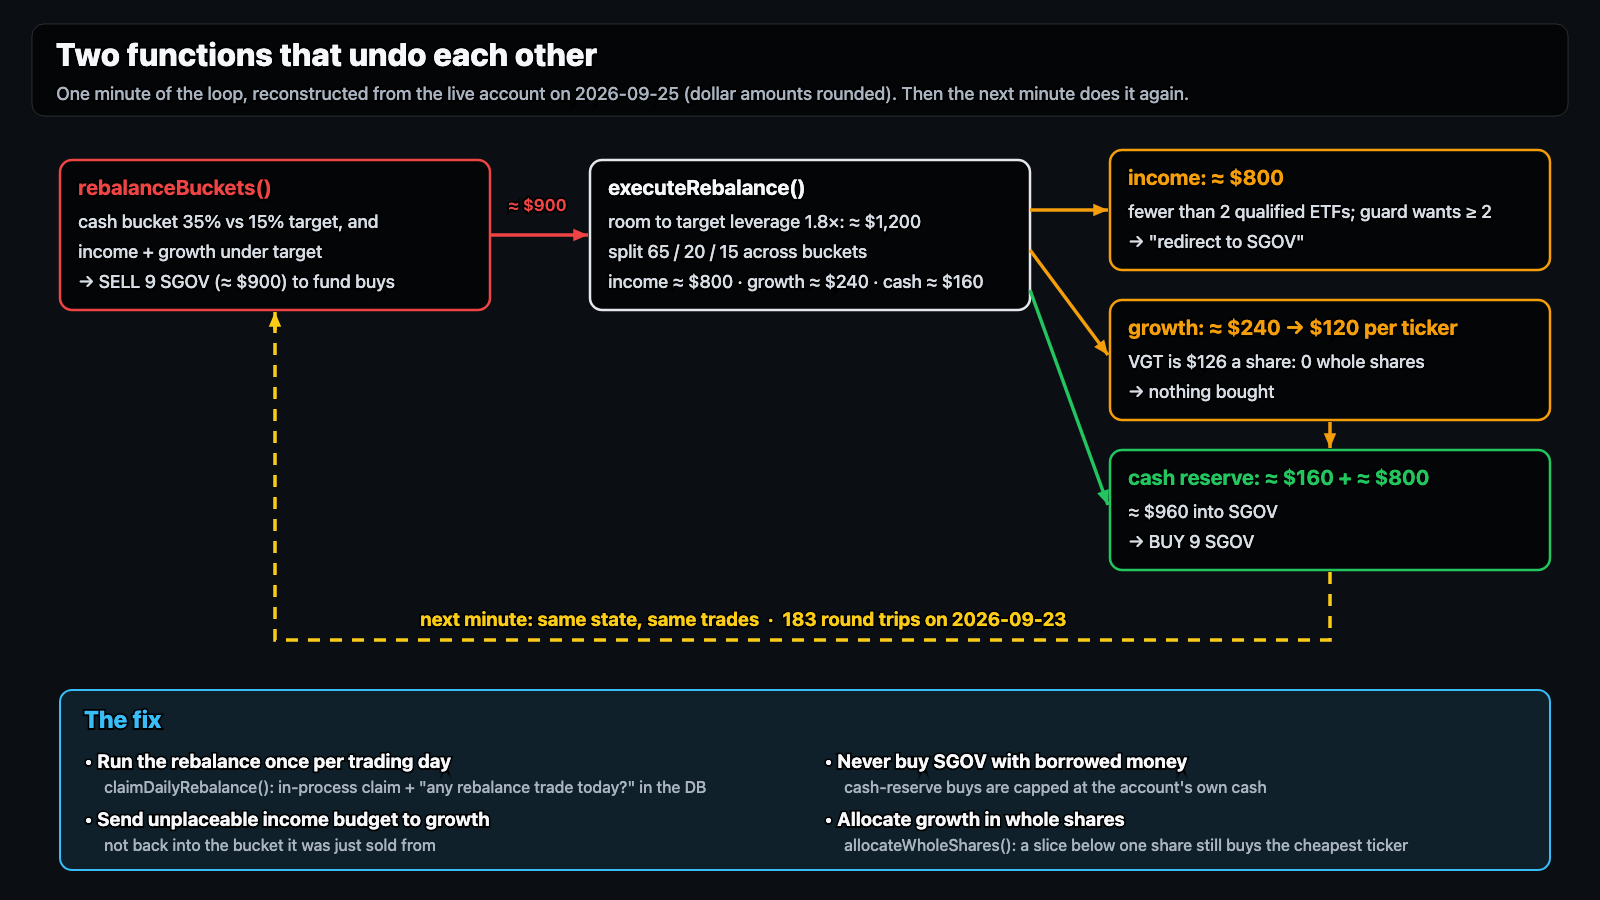
rebalanceBucketssees the cash bucket at 35% against a 15% target, so it sells about $900 of SGOV to fund income and growth buys.executeRebalancesplits the buying room across buckets. The income slice hits a concentration guard (fewer than two qualified ETFs) and is redirected to SGOV. The growth slice is $120 per ticker, and VGT costs $126 a share, so it buys zero whole shares.- Almost all of the budget lands back in SGOV: 9 shares, the same 9 it just sold.
The next minute starts from the same state and makes the same trades. Each function is reasonable on its own. Together they form a cycle, and a one-minute scheduler turns that cycle into hundreds of orders a day.
Step 4: Find out why exits never finished
Every partial exit had the same shape:
sharesToSell := math.Floor(holding.Shares * 0.5)
minKeep := config.MinPositionValue / holding.CurrentPrice   // keep $50
if holding.Shares-sharesToSell < minKeep {
    sharesToSell = math.Floor(holding.Shares - minKeep)
}
Three problems stack up:
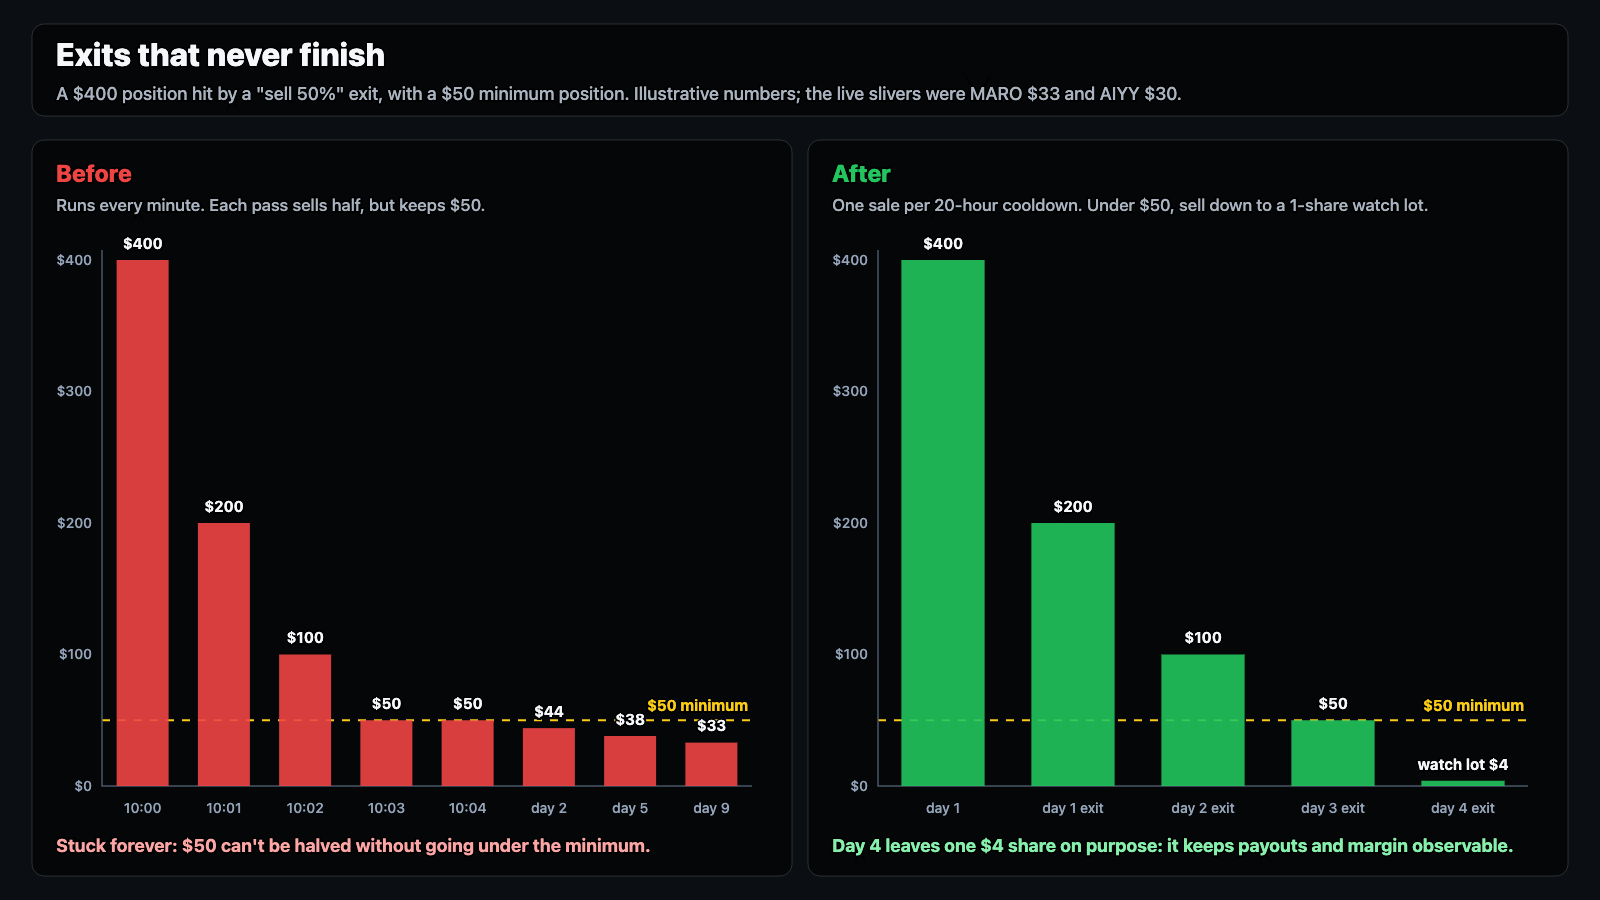
- “Sell half” repeats every minute. Nothing records that the exit already fired, so a 50% trim becomes 50% of what’s left, every cycle.
- The dollar floor stalls the exit. Once a position falls to about $50, half would dip below the floor, so it sells nothing. When the price drifts lower, the position is stuck below the floor for good. MARO ended at $33 and AIYY at $30.
- The decay counter counts minutes. The rule “decaying for 2 cycles” meant two screener runs. It counted loop passes, so it tripped in two minutes and reached 186.
Step 5: Don’t buy T-bills with borrowed money
The account had about $2,200 of margin debt and about $1,800 in SGOV. SGOV earns roughly the T-bill rate. Margin costs your broker’s margin rate, which sits above benchmark rates. Holding a T-bill fund on borrowed money pays the spread between the two for nothing.
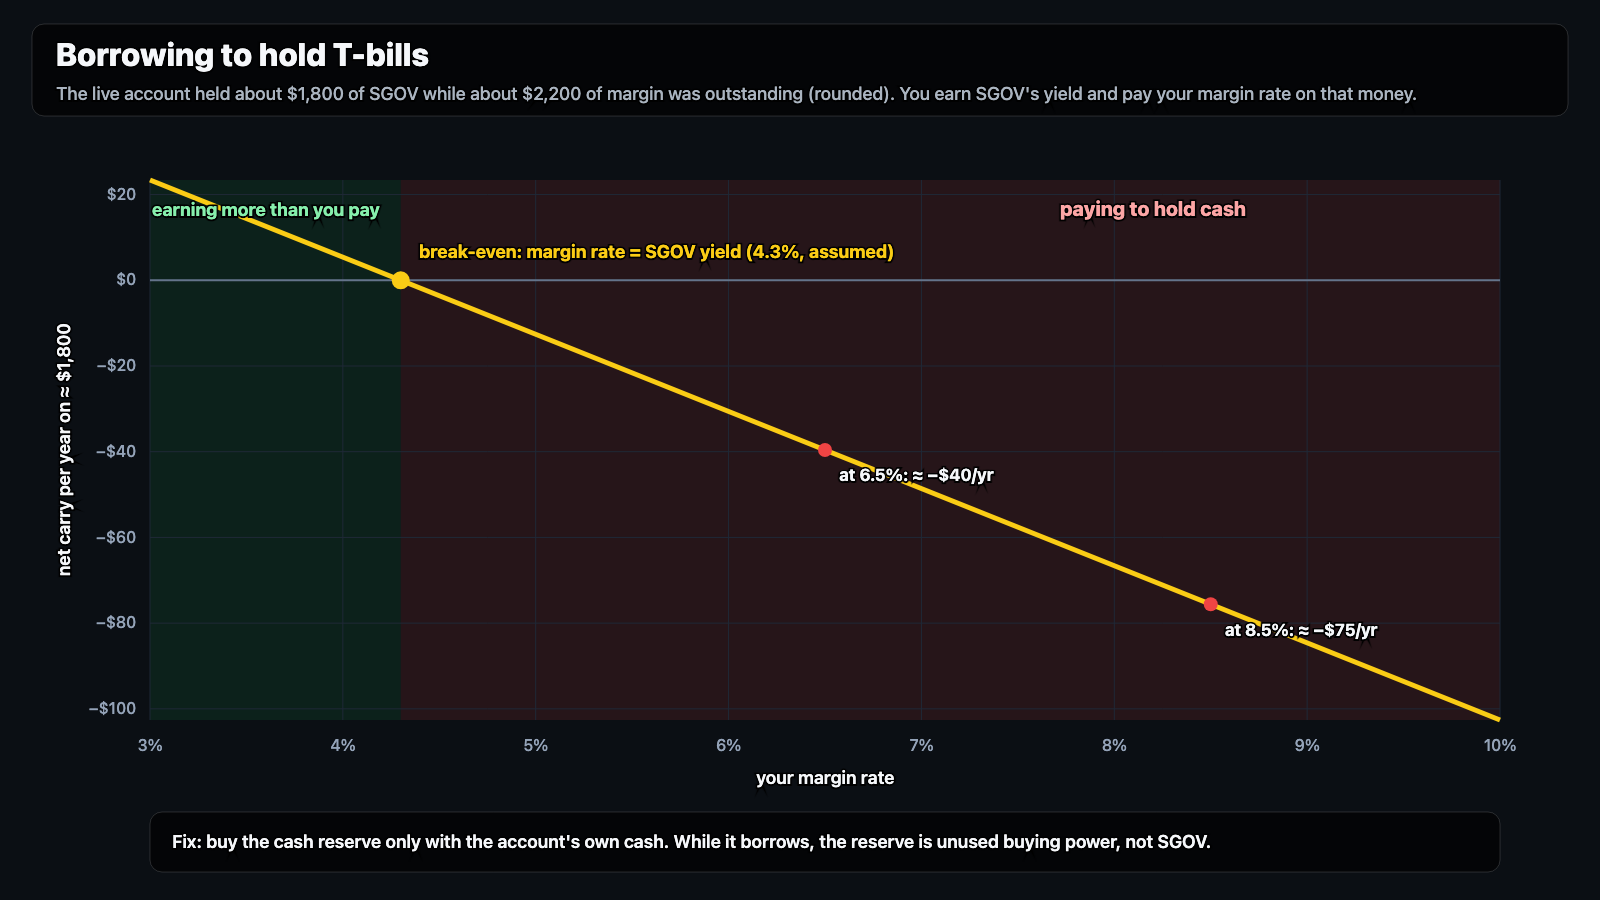
The dollar amounts are small on an account this size. The rule matters more.
The fixes: five small changes in one commit
All five fixes live in the agent’s Go package and shipped together in e9f51d1 high-yield: stop the minute-by-minute rebalance loop, finish exits, growth-first . Each is small.
Run the rebalance at most once per trading day. An in-process claim handles the common case. A database check covers restarts and other pods.
func claimDailyRebalance(db *gorm.DB, agentID uint, now time.Time, et *time.Location) bool {
    day := now.In(et).Format("2006-01-02")
    if last, ok := highYieldDailyRebalance.Load(agentID); ok && last.(string) == day {
        return false
    }
    if rebalancedToday(db, agentID, now, et) { // any rebalance-path trade since midnight ET?
        highYieldDailyRebalance.Store(agentID, day)
        return false
    }
    highYieldDailyRebalance.Store(agentID, day)
    return true
}
Break the SGOV cycle. Unplaceable income budget now goes to growth, not back into the bucket it was just sold from. Cash-reserve buys are capped at the account’s own cash:
if cash := account.Cash.InexactFloat64(); cashReserveBudget > cash {
    if cash <= 0 {
        cashReserveBudget = 0 // on margin: don't buy SGOV
    } else {
        cashReserveBudget = cash
    }
}
Allocate growth in whole shares. allocateWholeShares gives each ticker its equal slice. Then it spends the leftover one share at a time on whichever ticker is furthest below its slice. A budget of about $240 across $126 and $250 tickers now buys a VGT share instead of nothing.
Make exits finish, on purpose. An exit fires at most once per 20-hour cooldown. When the remainder would fall under the minimum, it sells down to a one-share watch lot and stops. The watch lot is deliberate. Holding one share keeps the fund’s payouts visible, and the broker’s margin requirement for it measurable. You can only measure margin requirement while you hold shares. That’s how a recovering ETF shows up as a new opportunity. Exit rules skip watch lots, so they no longer re-fire.
func partialExitShares(shares, price, fraction, minPositionValue, watchLot float64) float64 {
    if shares <= watchLot || price <= 0 {
        return 0
    }
    sell := math.Floor(shares * fraction)
    if (shares-sell)*price < minPositionValue {
        sell = shares - watchLot
    }
    return math.Max(sell, 0)
}
Count decay in trading days. trackScoreDecay records at most one snapshot per ET day, so “2 cycles” means two days again.
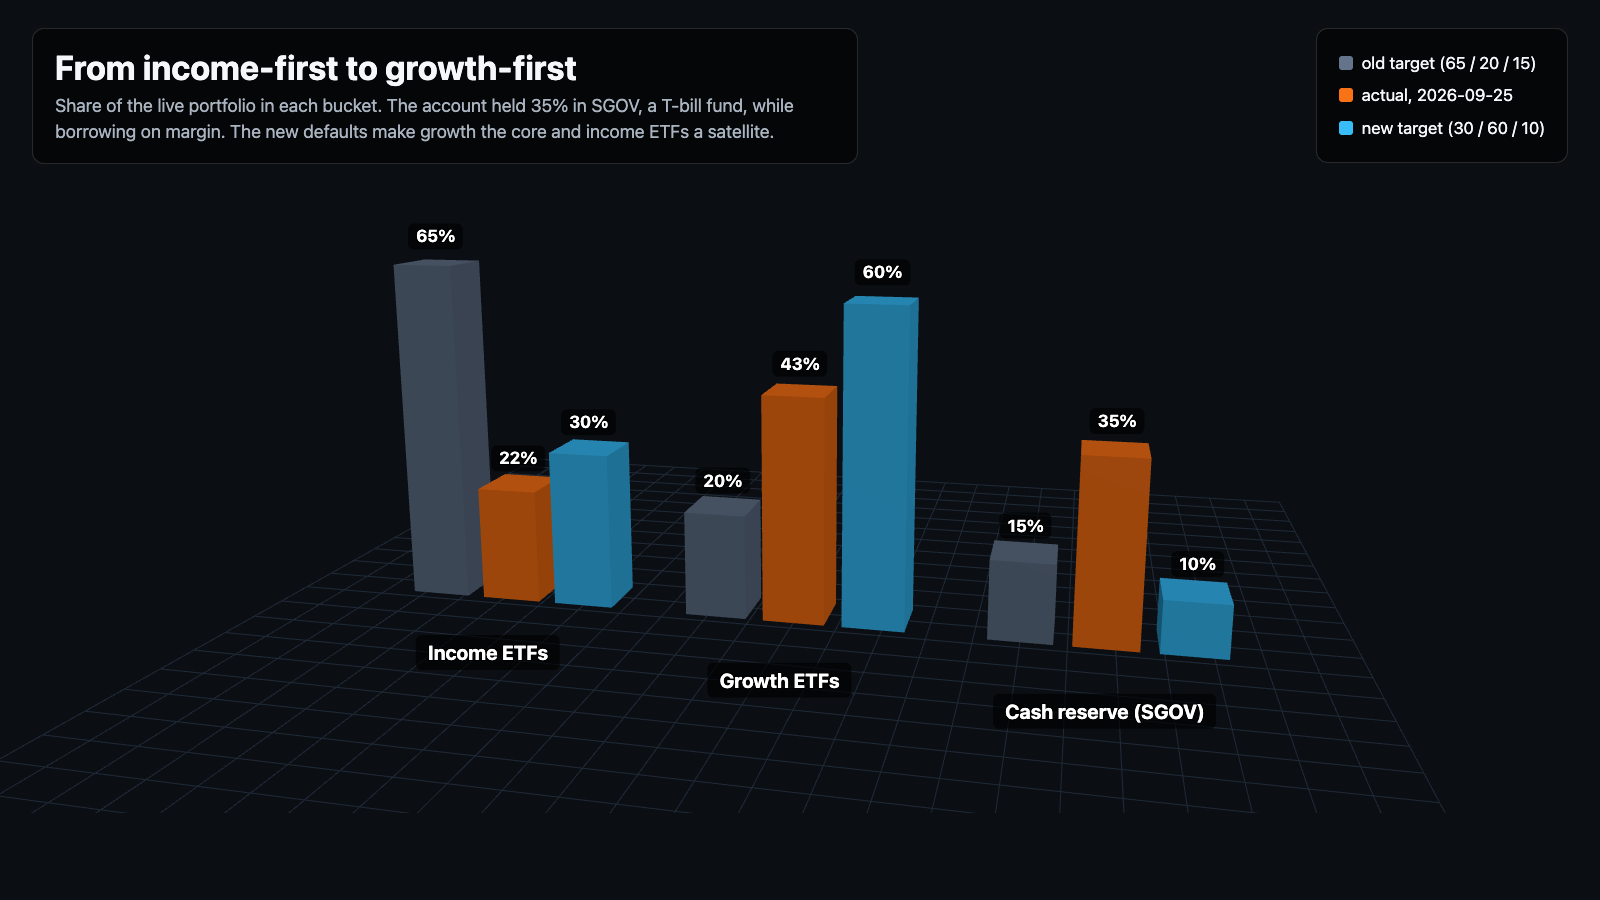
Rebalance toward growth. The defaults moved from income-first (65 / 20 / 15) to growth-first (30 / 60 / 10), with VGT, QQQM, and SCHG as growth tickers. The last section explains why.
Test it with the incident’s real numbers
Each fix has a test that encodes the incident’s real numbers:
TestRebalanceRunsOncePerDayclaims at 10:00, is refused at 10:01, and is allowed the next day.TestRebalanceGateSurvivesRestartseeds abucket_rebalancetrade from an hour ago and checks that a fresh process still refuses.TestPartialExitStopsAtWatchLotsells 8 MARO shares at $4.18 down to 1, and sells 0 from the 1-share lot.TestAllocateWholeShareschecks that $180 over VOO and VGT buys a VGT share where the old code bought nothing.
The diagnostics tool below has its own test. It runs against a fake Alpaca server (httptest) that serves the live account’s exact balances and positions. The test asserts that the tool flags the SGOV churn first, then the negative carry, the stalled exits, the 186-count decay counters, and the stale rows.
Guard it going forward: one diagnostics call
Each bug was visible in data the whole time. Nobody looked, because nothing surfaced it. So the fix ships with a read-only MCP tool, high_yield_diagnostics. It compares the agent to its broker account and lists what needs attention, most urgent first.
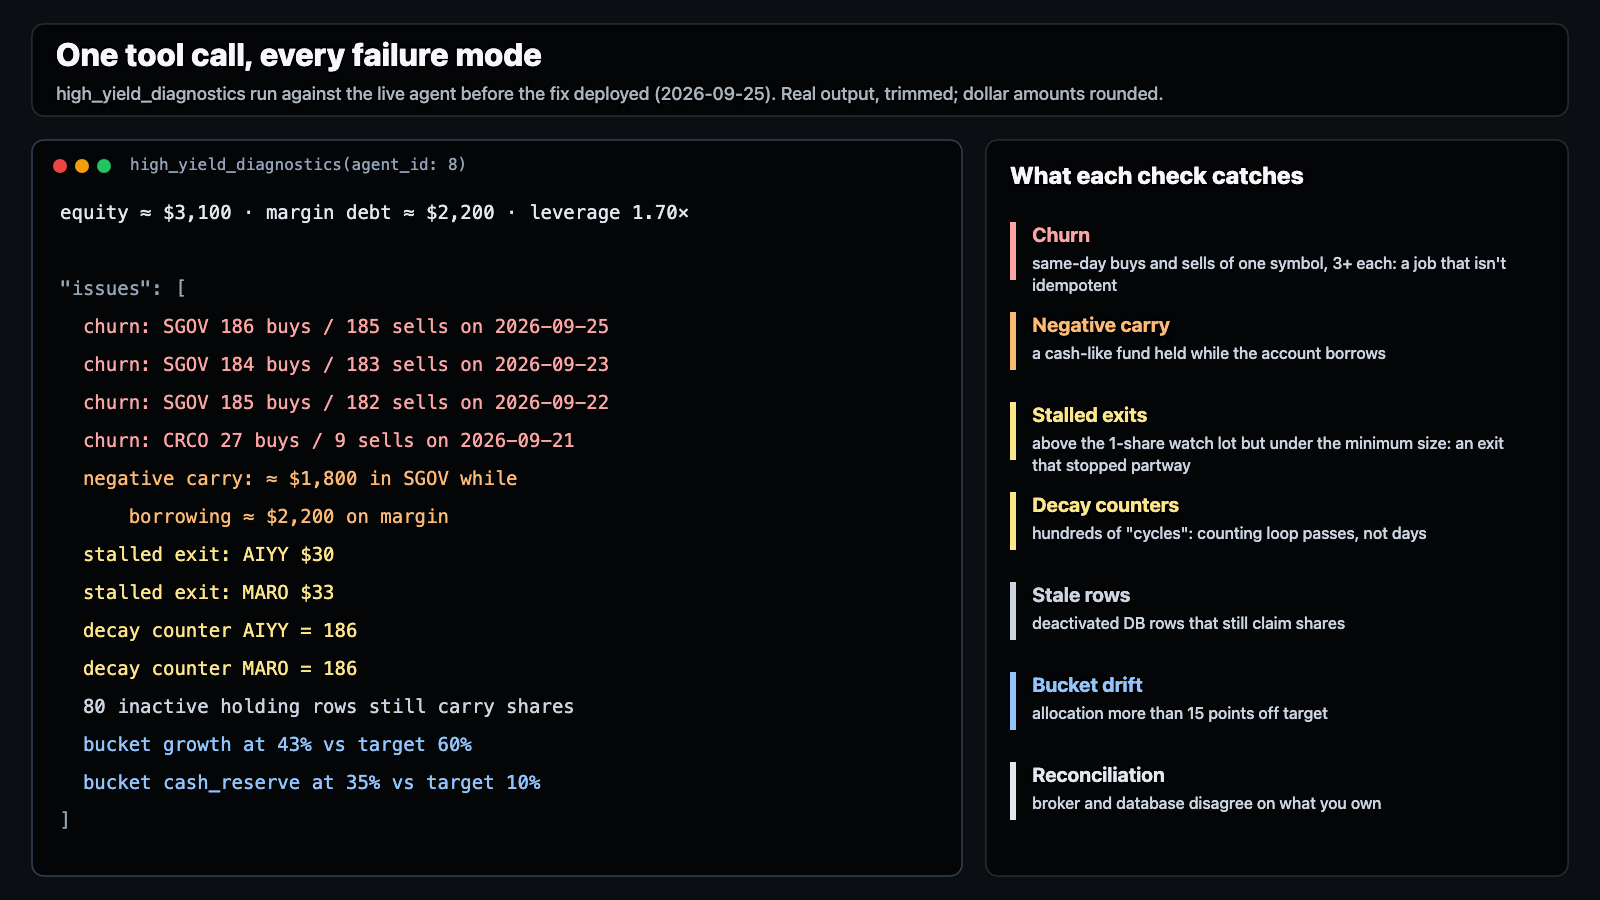
It checks for:
- Churn: three or more same-day buys and sells of one symbol. That points to a job that isn’t idempotent.
- Negative carry: a cash-like fund held while the account borrows.
- Stalled exits: positions above the watch lot but under the minimum size.
- Decay counters in the hundreds: a counter ticking on loop passes instead of days.
- Stale rows: deactivated database rows that still claim shares.
- Bucket drift: a bucket more than 15 points off target.
- Reconciliation: the broker and the database disagree on what you own.
One detail cost me a wrong first draft. The tool groups trades by day. The database session runs in Asia/Shanghai time, so DATE(created_at) split each New York session across two “days”. The tool now groups by Eastern trading day in Go.
What the real numbers say about growth
With the loop fixed, the harder question is whether the income bucket earns its place. Covered-call ETFs pay large distributions, but their share prices tend to erode. The question is by how much. The agent’s trade log turned out to be the wrong source for that. It nets SGOV to 34 shares while the broker holds 18, because some sells never made it into the log. I haven’t found that gap yet. So these numbers come from the broker’s own activity feed (fills and dividends), May 12 to September 25, 2026:
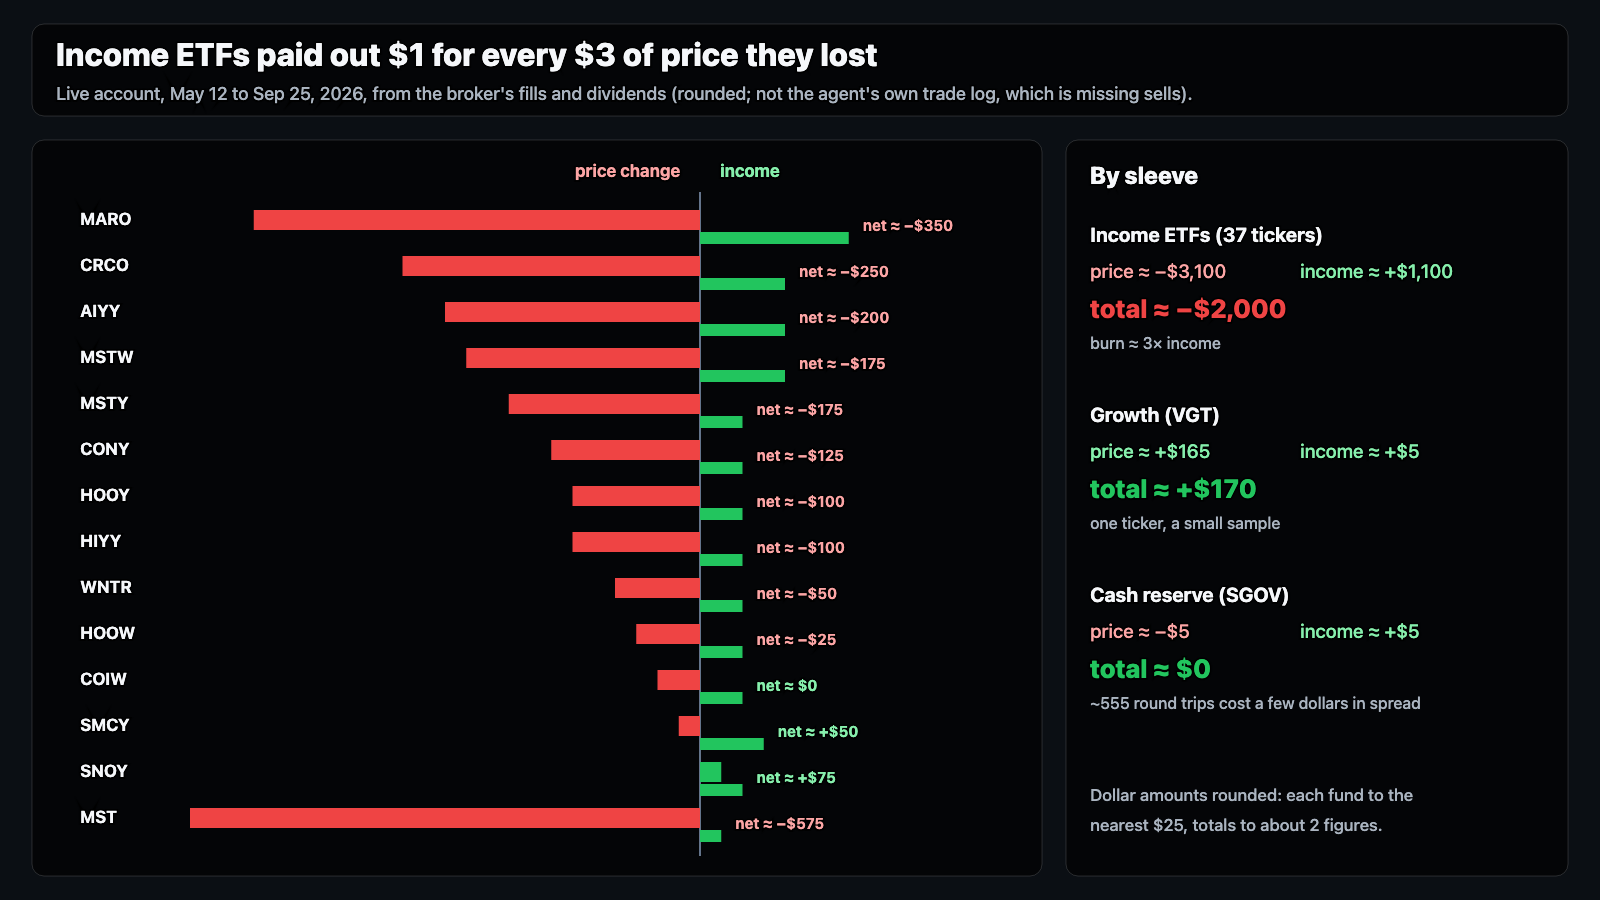
| Sleeve (rounded) | Price change | Income | Total |
|---|---|---|---|
| Income ETFs (37 tickers) | ≈ -$3,100 | ≈ +$1,100 | ≈ -$2,000 |
| Growth (VGT) | ≈ +$165 | ≈ +$5 | ≈ +$170 |
| Cash reserve (SGOV) | ≈ -$5 | ≈ +$5 | ≈ $0 |
The income ETFs lost about $3 of price for every $1 they paid out. The SGOV loop itself cost only a few dollars in spread across roughly 555 round trips. Its real cost was the capital it kept idle.
This suggests the growth weight shouldn’t be a fixed number. It should follow the measured burn ratio: price lost per dollar of income, per fund and for the income bucket as a whole, over a trailing window. When the bucket’s total return (price plus income) is negative, the weight should shift toward growth. When income funds more than cover their erosion, it can shift back. The watch lots make this possible for funds you’ve mostly exited. They keep reporting payouts, so you can see a fund’s burn improve before you commit capital again. The 30 / 60 / 10 split is a starting point. The burn data should drive it from here.
Takeaways you can apply to any scheduled job
- Make scheduled jobs idempotent for the cadence they actually run at. Match the scheduler’s cadence to the job’s, and add a “did this already happen today?” guard backed by durable state.
- Look for pairs of steps that undo each other. A sell step and a buy step that each fall back to the same asset form a cycle.
- Make exits terminate. Track that an exit fired, and give it a defined end state. A deliberate watch lot beats an accidental sliver.
- Count in domain time. Trading days, screener runs, and settlement periods, not loop iterations.
- Treat the broker as the source of truth for positions, fills, and income. Reconcile your tables against it on every run.
- Don’t hold cash-like funds on margin.
- Ship the diagnostic with the fix. Every bug here sat in plain view in the data. A single tool call now surfaces all of them.
Where the numbers come from
All values come from the live account on the dates stated: orders and positions from the Alpaca API, and the growth analysis from its account activities (fills and dividends). On this site, account dollar amounts are rounded (shown with ≈ or “about”): they show the shape of the problem, not an account statement. Share counts, trade counts, and ratios are exact. Two figures use stated assumptions instead: the 4.3% SGOV yield in the carry chart, and the $400 example position in the exit chart. The trade-log gap (34 SGOV shares logged against 18 held) is still open, which is why no number here is built on that log.
For how I validate the rest of this system, see TrendVesting: validating 2.5 years of production AI. If you run scheduled agents against a broker or any metered API and want a second pair of eyes on loops like this one, that’s work I take on.