Who pays for the KV cache? Designing showback for shared LLM inference
A guide for platform and FinOps leads who have to split shared AI spend: which meter to charge by, where idle capacity goes, how to give every dollar one path into the ledger, and what a joined ledger can answer. Backed by measurements from unalloc, my open-source cost-attribution tool.
On this page
- Decision 1: a token meter is a pricing choice, not a measurement
- Prefill is batched and decode is not, so RAG and agents trade places
- Prefix caching moves the bill for the shared prompt
- Which meters you can compute from logs, and which need telemetry
- Idle GPUs and empty KV pools belong on their own line
- One path per dollar, reconciled against the invoice
- Label the few rows that hold most of the unowned money
- Feature unit economics need both ledgers
- Self-hosting pays off at a utilization, not a price
- A decision checklist for LLM showback
- What I didn’t check
At a glance
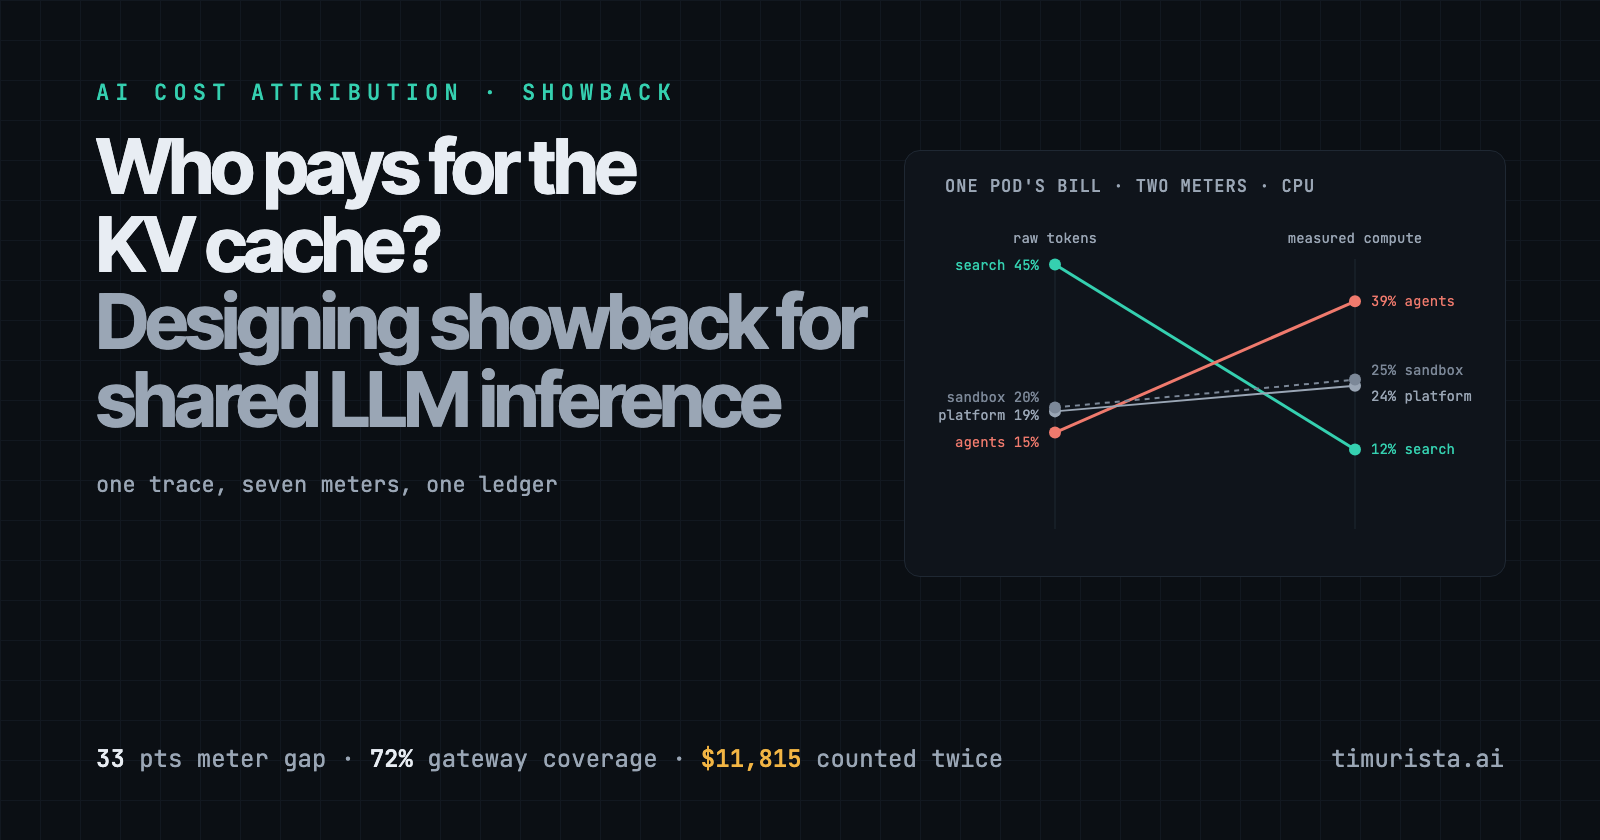
- On one measured trace, raw token counts gave a RAG tenant 45.4% of a shared pod's bill and measured compute gave it 12.4%. That is a 33-point disagreement on CPU, or $5,703 of an illustrative $17,280 month, so the meter has to be a written decision.
- Prefix caching moves money only if the meter lets it. At 1 request/s in simulation, a cached-input discount moved 14.3 points of the bill off the agents tenant, while measured step time moved 1.9 points.
- Overhead needs its own line. The same simulated run reported 84.5% or 9.1% unallocated depending only on whether idle KV memory was an unlabeled row or redistributed as shared cost.
- Pick sources so each dollar arrives once. With every source on, $11,815 of gateway spend was counted twice, and the gateway alone reconciled to only 72.1% of provider invoices.
- A joined ledger answers more than who owns spend. Three label changes took a synthetic org from 66.9% to 1.9% unallocated, and a simulated GPU beat a mid-tier API above roughly 0.23 requests/s.
If you run a shared inference server, someone will eventually ask you to split its bill. The platform team pays for the GPUs. Search, agents and a handful of internal tools send requests. Finance wants each team’s share on a monthly report, and the teams want to know the rule before they see the number.
Most organizations pick that rule by accident: the gateway already counts tokens, so tokens become the bill. This piece is for the platform or FinOps lead who has to defend a showback report. It takes the decisions in order: which meter, what to do with overhead, which sources feed the ledger, and what else a joined ledger can answer.
The evidence comes from unalloc, my open-source CLI that joins OpenCost allocations with LiteLLM, OpenAI and Anthropic bills and reports the spend nobody owns. It also draws on the case studies in the paper, added in 2876321 inference cost case studies . Every dollar figure below comes from a synthetic, illustrative month, and the fixture output is synthetic too. The shares and the direction of each effect are the point, not the prices. How the numbers were checked, including a run on a rented H100, is in Part 10 of Human in the Loop.
Meters disagree
33 pts
Raw tokens vs measured compute, one tenant, CPU
Counted twice
$11,815
Every source on, illustrative month
Gateway coverage
72.1%
Of provider invoices; one team bypassed it
Self-host break-even
≈0.23 req/s
Against a mid-tier API, simulated
Decision 1: a token meter is a pricing choice, not a measurement
Start with what a meter is. It’s a rule that turns one pod’s bill into per-tenant shares. To see how much the rule matters, unalloc’s torch_kv study served a 96-request trace on CPU, using a 3.3M-parameter PyTorch decoder with a real KV cache. Four tenants had different shapes:
- search is RAG: long prompts, short answers.
- agents sends short prompts and gets long outputs.
- platform sits in between.
- sandbox is a shared key with no owner.
The same measured trace was then priced against one illustrative $17,280 month (8 GPUs for 720 hours at $3.00) and split seven ways.
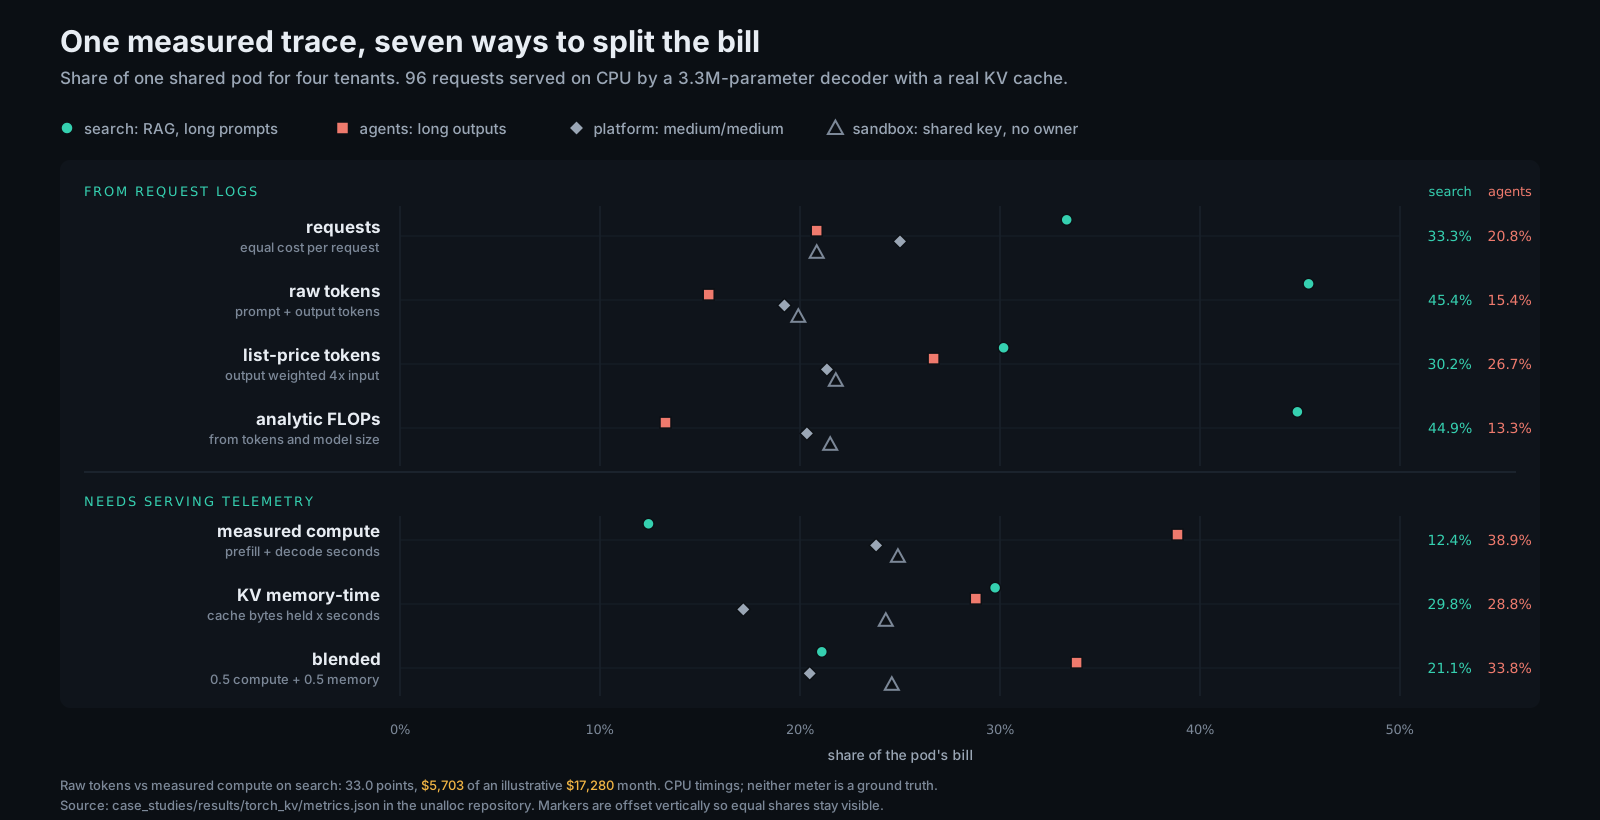
Search’s share runs from 12.4% under measured compute to 45.4% under raw tokens. Agents runs from 15.4% to 38.9%. Charging per request gives search a third, because it sent a third of the requests. List-price tokens, with output weighted at 4× input the way API price sheets do, give it 30.2%. Each rule is defensible, and none is ground truth.
The widest gap is between raw tokens and measured compute: 33 points on search’s share, $5,703 of the illustrative month. Weighting output at 4× halves that to 17.8 points without closing it. The meter moves real money between teams, so write it down.
Prefill is batched and decode is not, so RAG and agents trade places
The reason is mechanical. Prefill reads the whole prompt in one forward pass and processes its tokens in parallel. Decode produces one token per step, and each step is another pass through the model against the KV cache. A token meter prices a prompt token and an output token the same way. The hardware doesn’t.
The trace shows the asymmetry directly:
- search sent 18,024 prompt tokens and received 701. Its requests spent 0.41 seconds in prefill and 0.59 in decode.
- agents sent 2,345 and received 4,017. Its requests spent 0.05 seconds prefilling and 3.07 seconds decoding.
Measured cost per token differed 9.2× between search and agents, and a flat token price charges both the same. That’s why the tenants trade places. By raw tokens, search is the most expensive tenant and agents the cheapest. By measured compute the order flips. KV memory-time puts them almost level, at 29.8% and 28.8%, because search holds a long context for a few steps and agents holds a shorter one for many.
A CPU exaggerates the size of this effect, because an unbatched decode step carries a large fixed overhead. The direction held on production serving software. On an H100 running vLLM, a token meter gave search 16.5–18.9% of the bill and a time-share meter about 5%: 11.7–13.7 points apart at every load, as 0b5a8bb the H100 results record and Part 10 explains.
Prefix caching moves the bill for the shared prompt
Prefix caching changes what the hardware does. Whether it changes what a tenant pays depends on the meter. The kv_cache study simulates a vLLM-style engine with paged KV blocks, prefix caching, chunked prefill and continuous batching. Its agents tenant re-sends the whole conversation each turn. At 3 requests/s for 30 simulated minutes, the cache hit rate was 75% overall: 92.6% of agents’ prompt tokens came from cache, 33.7% of search’s, and none of sandbox’s.
Running the same offered load of 1 request/s with caching on and off shows three meters reacting differently:
- Raw tokens didn’t move: agents paid 71.1% with caching and 71.0% without. A token meter counts a cached token like any other.
- Measured step time moved 1.9 points (73.0% against 74.9%), because most of agents’ cost is decode, which caching doesn’t touch.
- List-price tokens, charging cached input at 0.1×, moved 14.3 points off agents (57.3% against 71.6%).
So if you pass a provider-style cached-input discount through to internal tenants, you reward cache-friendly traffic far more than the compute it saves. That may be exactly the incentive you want, since it rewards stable system prompts. Just decide it rather than inheriting it from a price sheet.
There’s a second decision hiding here: who pays to materialize a shared prefix the first time. The CPU study spreads the shared system prompt’s prefill across the requests that hit it. PrefixShield, cited in the paper’s related work, takes a scheduling approach and makes tenant groups responsible for the prefix-cache blocks they materialize. Either is defensible. Write down which one you use.
Which meters you can compute from logs, and which need telemetry
Each meter needs different data:
- Request or gateway logs: requests, raw tokens, and list-price tokens. A cached-input discount also needs the cached-token count per request, which the H100 run read from the server’s response. Analytic FLOPs need only tokens and model size, and they tracked tokens almost exactly: 44.9% for search against 45.4%.
- Request timestamps: time share. The H100 run split every 50 ms of wall time equally across in-flight requests, which needs only when each request started and finished.
- Serving telemetry: measured compute, which splits each step’s duration by each sequence’s marginal work, and KV memory-time, which integrates the cache blocks each request holds. Both also expose overhead, which is the next decision.
My advice: start with list-price tokens, which you can compute today and which are honest about being a price. Run one telemetry meter beside them for a quarter. If the gap is a couple of points, keep the simple rule. If a prompt-heavy team carries double digits, talk before the numbers reach a budget.
Idle GPUs and empty KV pools belong on their own line
Every meter above divides up what requests did. A shared pod also costs money while doing nothing for anyone, and each meter hides that differently.
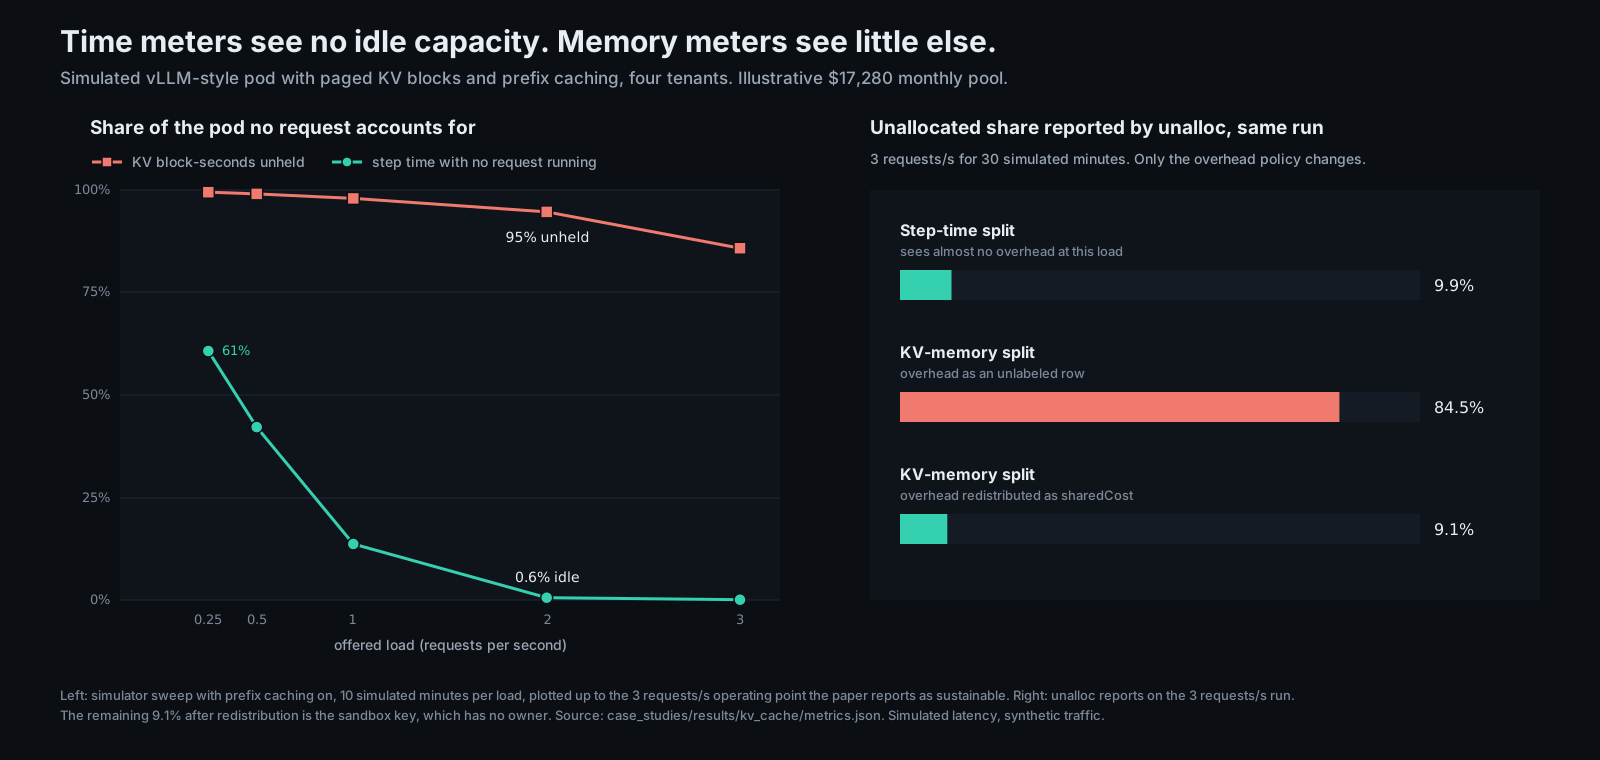
- Time-based meters see no idle capacity. With continuous batching there’s almost always some request in flight. Idle step time fell from 61% of the pod at 0.25 requests/s to 0.6% at 2, while the pod produced 754 output tokens a second against a capacity of roughly 1,340.
- Memory-based meters see little else. At the same load, 95% of KV block-seconds were held by no request, because pools are sized for peaks. At 3 requests/s, a KV-memory meter left 83% of the bill with no request at all.
That choice flows straight into the headline. With the memory split and overhead emitted as an unlabeled row, unalloc reports 84.5% unallocated. Redistribute the same overhead as OpenCost sharedCost and it reports 9.1%, which is just the ownerless sandbox key.
Multi-pod serving adds a third kind of overhead: time spent in collectives. In the distributed study’s illustrative $38,400 month, GPU time in communication totaled $12,059. A per-token showback spreads that by token share, which moved $3,737 from the tensor-parallel tenant onto the pipeline-parallel one. The communication fractions came from CPU loopback, which inflates them. At a more GPU-like 10% communication fraction, the transfer was $166. How much this decision matters depends on your interconnect.
Idle step time
61% → 0.6%
From 0.25 to 2 req/s, simulated
KV block-seconds unheld
95%
At 2 req/s, same simulation
Unallocated share
84.5% / 9.1%
One run, two overhead policies
Communication moved
$3,737
By per-token showback, illustrative month
Keep idle GPUs, unheld KV blocks and communication time as named overhead lines. Redistribute them by a written rule, such as pro rata to usage or to reserved capacity, and keep the pre-redistribution total visible for capacity planners. Shapley values and dominant resource fairness, both cited in the paper, are the classical foundations for a principled split.
One path per dollar, reconciled against the invoice
The meter decides how a pod’s bill is divided. Source selection decides whether the bill is right in the first place. The hybrid_e2e study models a common setup: a LiteLLM gateway in front of OpenAI and Anthropic, a self-hosted cluster, and a research team calling the providers directly. The unalloc CLI ran against mock servers that enforce each provider’s real authentication and pagination.
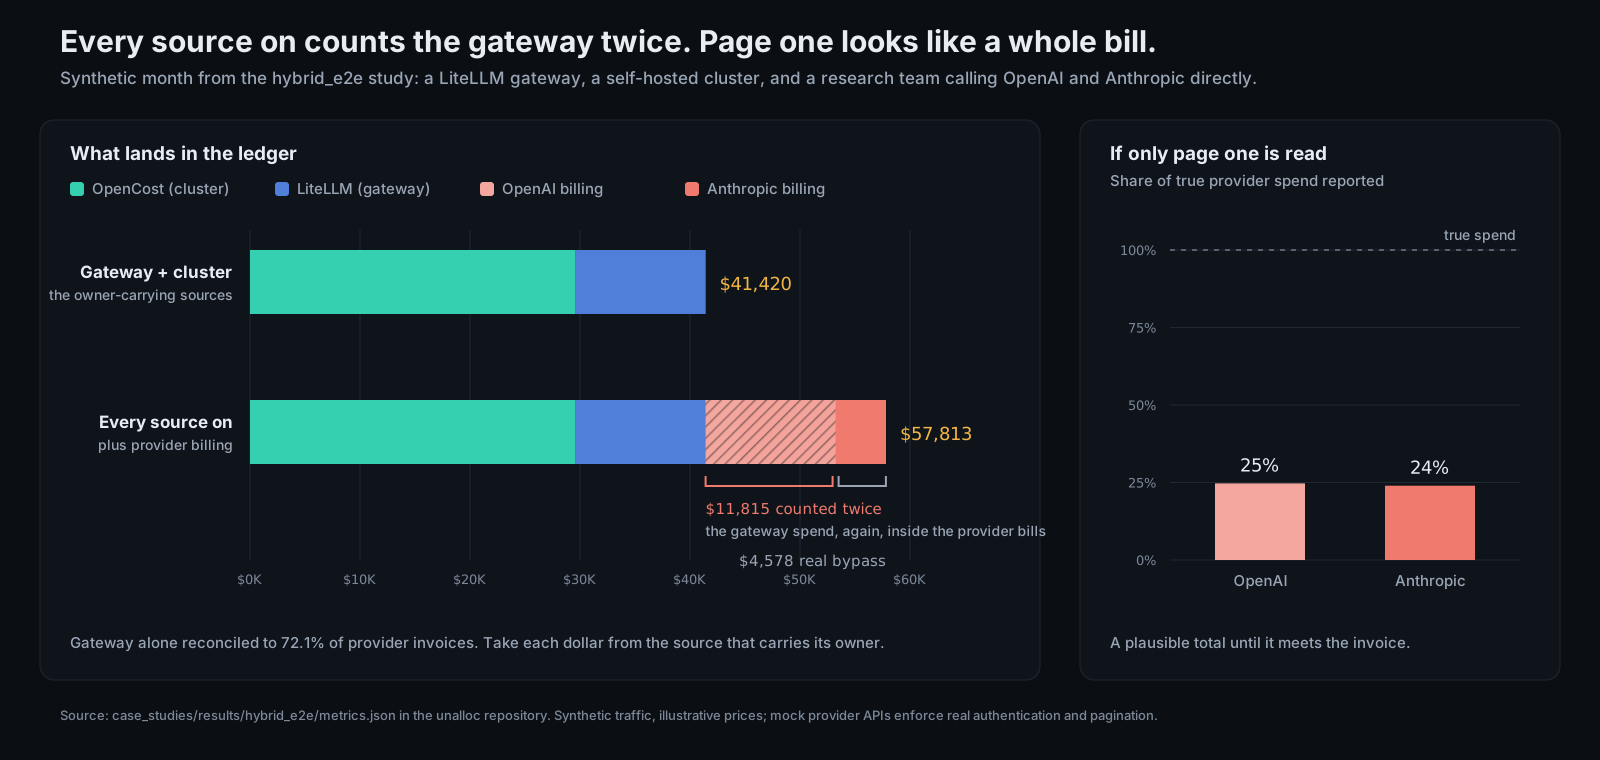
- Every source on: the ledger totaled $57,813. Provider billing added $16,393, of which $11,815, exactly the gateway’s spend, was counted twice. The remaining $4,578 was real bypass traffic.
- Cluster plus gateway: the ledger totaled $41,420, but the gateway reconciled to only 72.1% of the provider invoices. It under-reported by $4,578 and couldn’t tell without a reconciliation.
- Provider billing alone: there’s no team dimension. Falling back to project and workspace reports 0% unallocated while attributing nothing to a team.
The rule I’d use is to take each dollar from the source that carries its owner. For traffic through the gateway, that’s the gateway, whose keys and tags carry teams. For self-hosted serving, it’s OpenCost. Provider billing is for the bypass the gateway never saw, found by reconciling against the invoice. unalloc’s reconcile command compares each source’s ledger total with a billed amount and flags deltas above a tolerance. In the study, the provider ledgers matched their invoices exactly, and the gateway sat 27.9% under.
Label the few rows that hold most of the unowned money
Once the ledger is right, the governance work is labeling, and it’s a Pareto problem. Sort unowned rows by dollars and fix the top of the list. In the hybrid organization, 65 of 222 rows had no team. One label change took unallocated spend from 66.9% to 27.5%, a second to 12.8%, and a third to 1.9%. The bundled fixtures are less steep: they need seven of their 11 fixes to cross 10%.
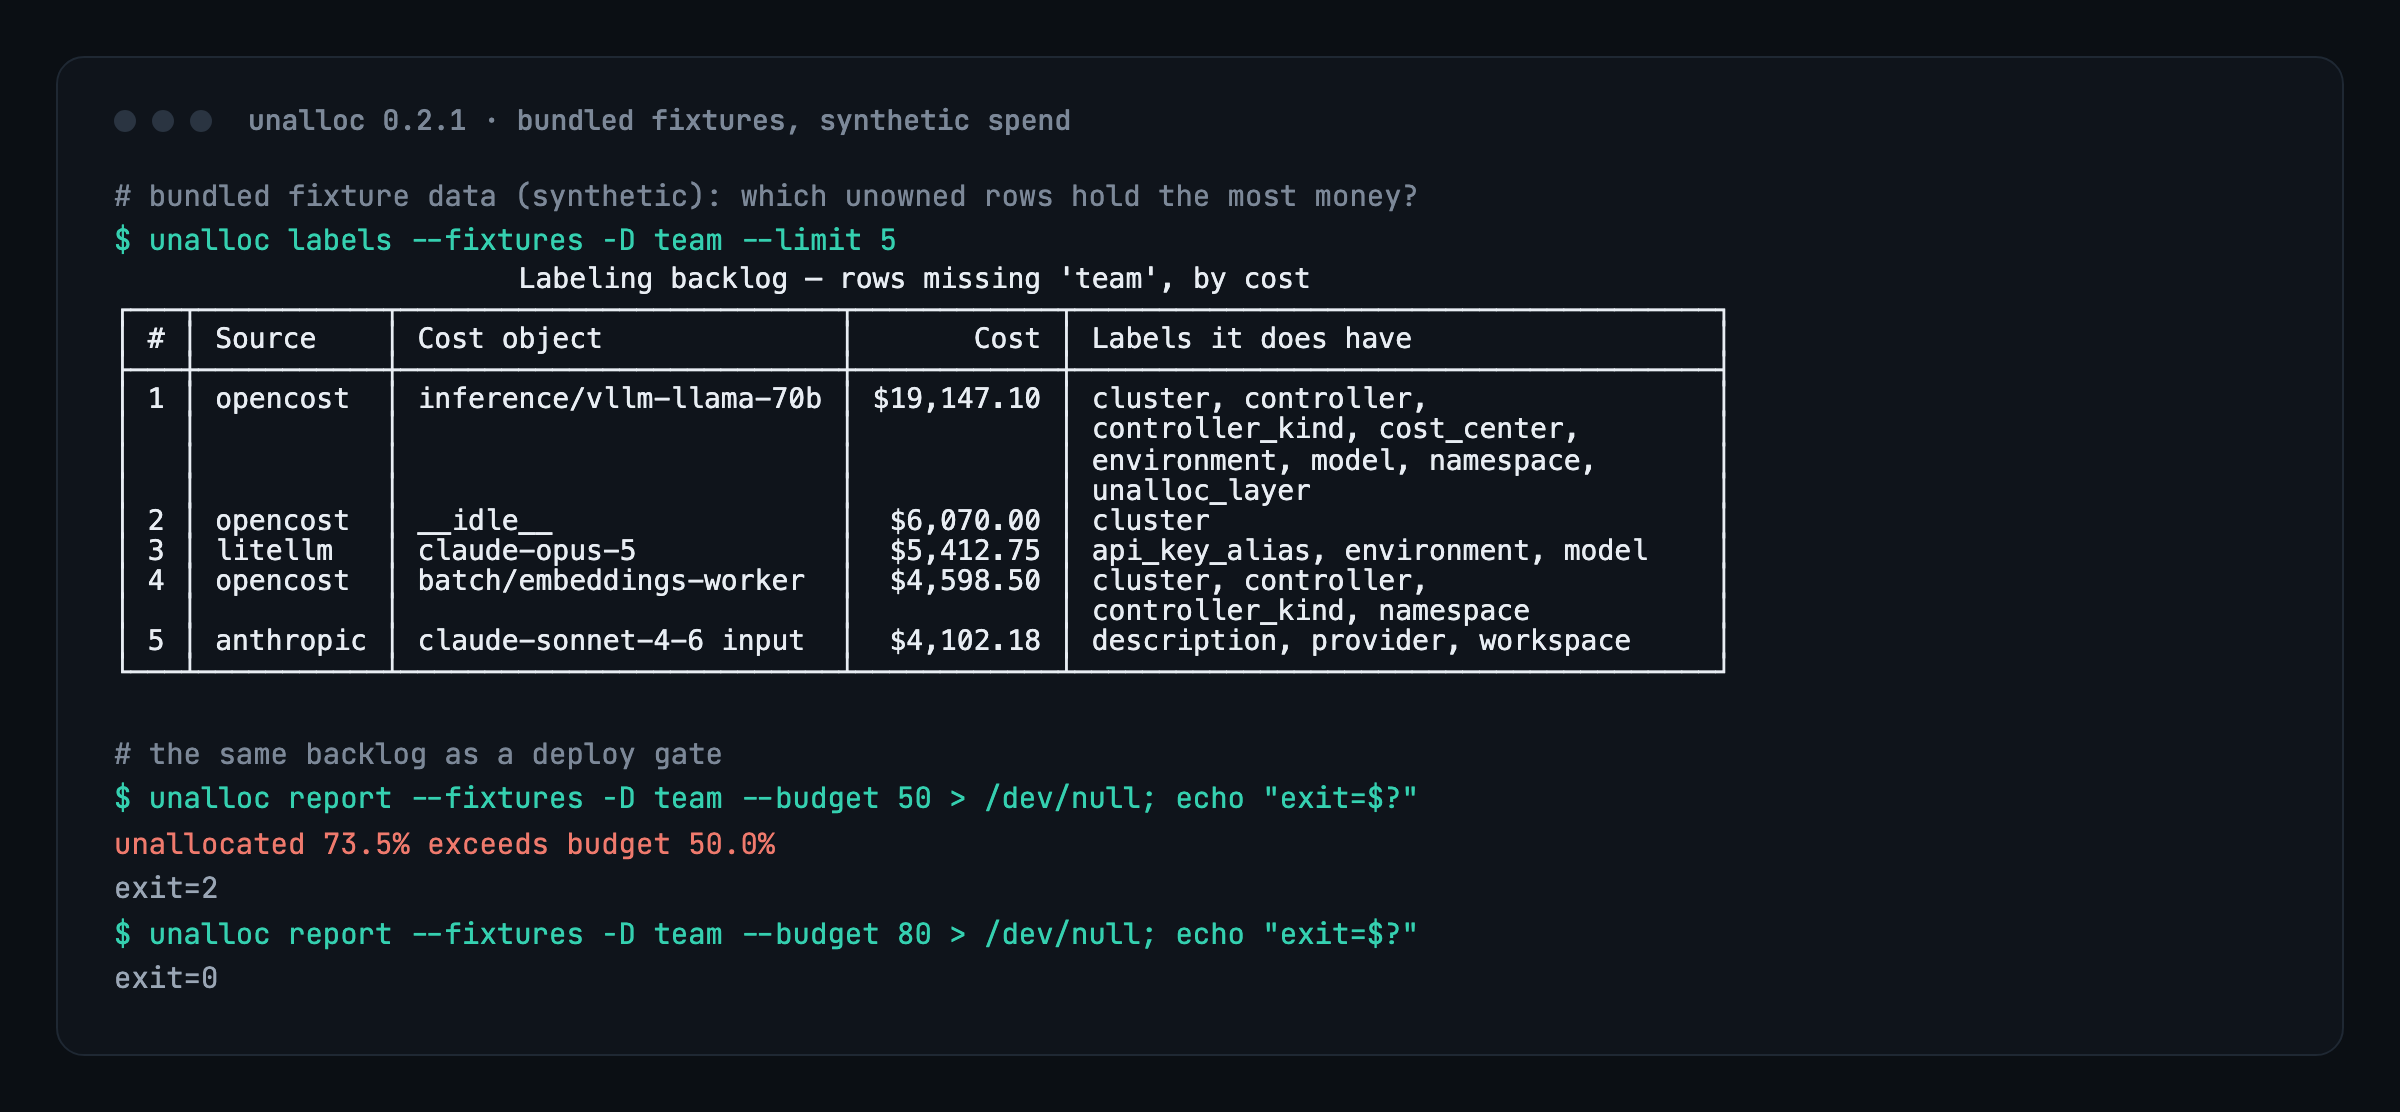
Look at row two. In both backlogs, the second-largest unowned item is __idle__ at $6,070. No team forgot to tag it. It’s the overhead decision from the previous sections, turning up as a labeling ticket. Treat idle rows as a policy question, and route them to whoever owns the redistribution rule.
The same backlog can gate deploys. unalloc report --budget 50 exits 2 on the fixtures, which are 73.5% unallocated, and --budget 80 exits 0. Set the budget just above today’s share and lower it as labels land, so a release that ships unowned spend fails review instead of showing up in next month’s report.
Feature unit economics need both ledgers
Product teams ask what a feature costs, not what a team costs. unalloc canonicalizes label keys, so a pod’s feature label and a gateway feature:answer request tag land on the same dimension. Joined that way, the hybrid organization’s RAG “answer” feature cost $22.32 per thousand requests including its vector database, against $13.38 counting only its LLM bill. That’s 40% of the feature’s cost invisible to a gateway-only view.
The decision is small but early: agree on one feature key for pods and gateway traffic, and put it in the deployment templates.
Self-hosting pays off at a utilization, not a price
Build versus buy usually arrives as a list-price comparison, but it’s a utilization question. The use_cases study compared one simulated GPU at $3.00 an hour, billed whether busy or not, with the same traffic’s tokens at two illustrative API tiers. The mid tier charged $1.00 input, $0.10 cached and $5.00 output per million tokens. The small tier charged $0.15, $0.075 and $0.60.
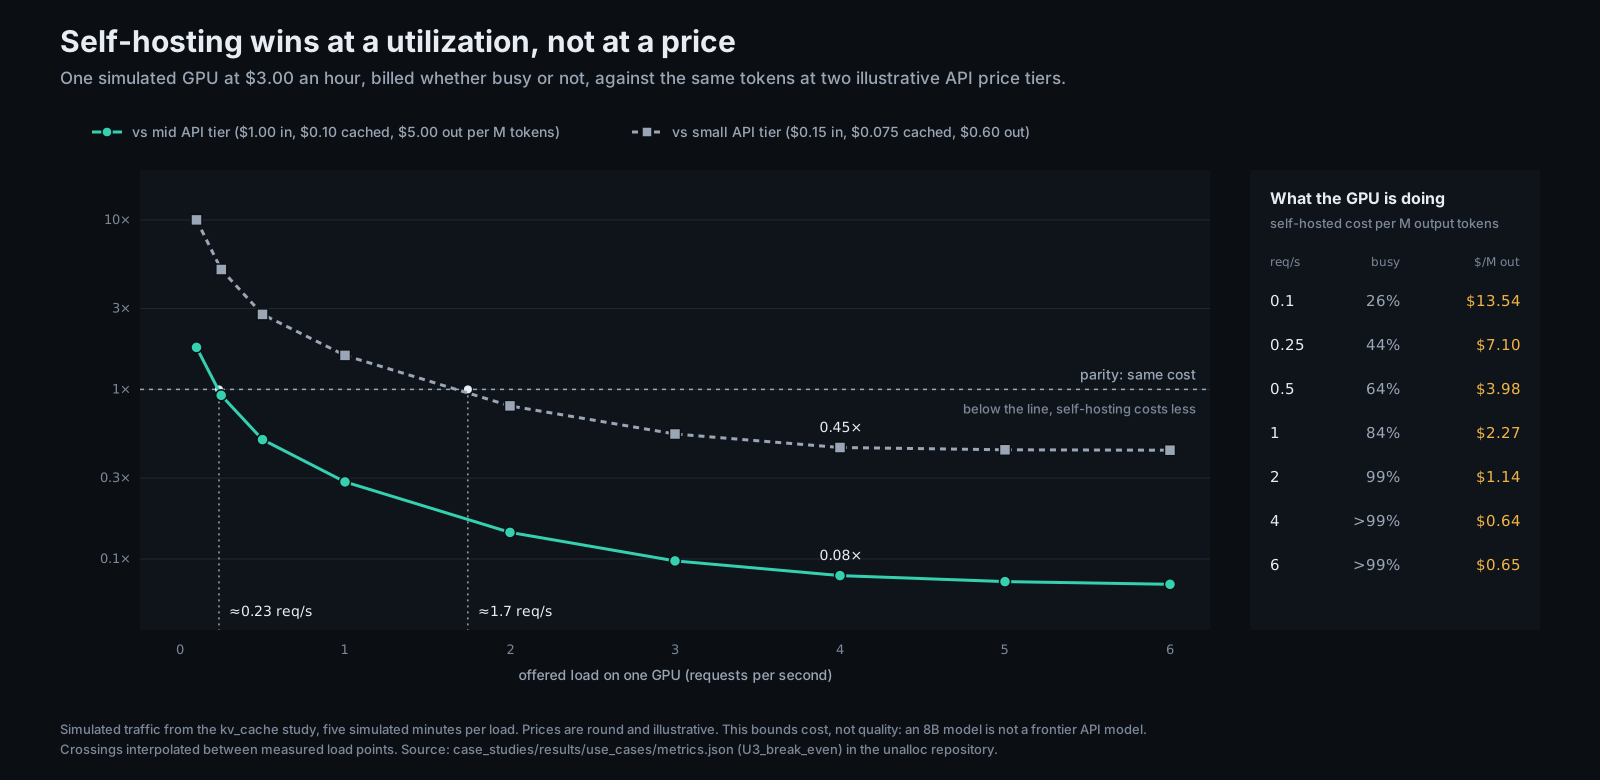
In simulation, self-hosting was cheaper than the mid-tier API above roughly 0.23 requests/s and cheaper than the small-tier API above roughly 1.7 requests/s. The ratios flattened at 0.08× and 0.45× by 4 requests/s, once the GPU was saturated. The side table shows why: at 0.1 requests/s the GPU was busy 26% of the time and each million output tokens cost $13.54, and at 4 requests/s it cost $0.64.
Both inputs come from the joined ledger: utilization from the cluster side and token mix from the gateway. The comparison holds tokens equal, not quality. An 8B model is not a frontier API model, and GPU hours aren’t the only cost of running one.
A decision checklist for LLM showback
- Name the meter and publish it with every share. List-price tokens from logs are a fine start if that’s what you can compute today.
- Run one telemetry meter alongside for a quarter, either step time or KV memory-time, and report how far it disagrees with the pricing rule for your traffic.
- Decide whether cached-input discounts pass through to tenants, and who pays to materialize a shared prefix.
- Keep idle GPUs, unheld KV blocks and communication time as named overhead lines, then redistribute them by a written rule.
- Give each dollar exactly one source, and reconcile every source against its invoice monthly before publishing shares.
- Work the labeling backlog in dollar order, and route idle rows to the owner of the overhead policy.
- Agree on one
featurelabel across cluster and gateway so unit costs include infrastructure. - Put an unallocated budget in CI, and compare self-hosting with APIs at your measured utilization.
What I didn’t check
- No ground truth. Every meter here is a defensible rule, and the results show how far rules disagree, not which one is right. JouleShare (Luo et al.) measures request-level Shapley energy on vLLM by replaying subsets of requests, and concludes that token attribution is not a reliable proxy under batched serving. Doing the same for four tenants would take 15 subset runs per load level. I haven’t run them.
- Mostly CPU and simulation. Measured compute and KV memory-time come from a CPU decoder. Overhead, prefix caching and break-even come from a simulator whose latency constants are uncalibrated. Only the token versus time-share disagreement was re-measured on real serving hardware.
- Synthetic traffic and illustrative prices. Every dollar figure comes from a generated month, and the CLI output comes from bundled fixtures.
- Break-even ignores people. It counts GPU hours at equal tokens, not engineering time, on-call load or model quality.
- Redistribution rules weren’t compared with each other. The studies set one policy, shared cost, against leaving overhead unlabeled. Usage-weighted and reservation-weighted splits are untested.
- No real invoices. The mock provider APIs reproduce documented authentication and pagination, not every field of a live response. A scrubbed export from a real OpenCost and LiteLLM deployment would test the source rules better than any simulated month.
unalloc is on GitHub, and pip install unalloc installs 0.2.1. The paper, blog posts and ledger explorer are on the project site, and every release is archived at doi:10.5281/zenodo.22761012.
If you need to split shared AI spend in a way the teams paying for it will accept, that’s the work I do.
The validation story behind these numbers is Part 10 of Human in the Loop.